Kube node metrics with Netdata Kubernetes monitoring
If you are running a Kubernetes cluster, you will no doubt agree that monitoring is pretty high on the list of things you need to do to make sure things are healthy and happy in the cluster. I have written about Netdata a few times and have been trying it out in the home lab with containerized workload monitoring and now getting kube node metrics for visibility. Let’s take a look at how to monitor your Kubernetes environmment with Netdata.
Table of contents
Brief Netdata overview
Netdata is a solution that allows monitoring all types of infrastructure in an easy way. You simply deploy a lightweight agent on your infrastructure nodes and it immediately starts streaming metrics to their cloud dashboard.
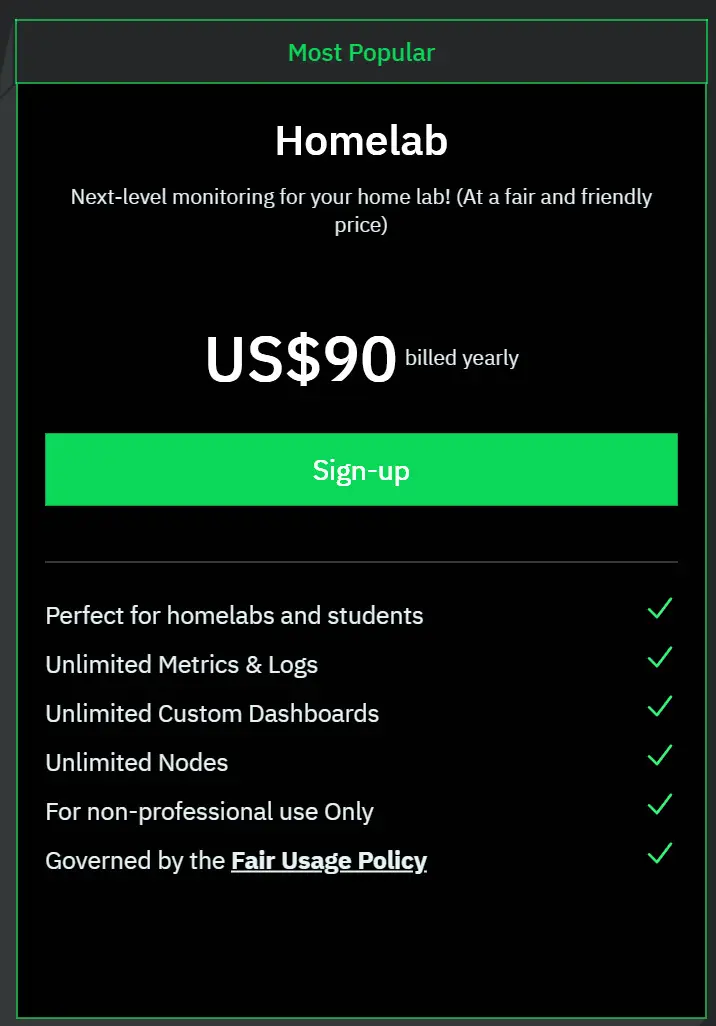
They also have a home lab license you can purchase for $90 a year at the time of this writing to run as many nodes as you want in your lab environment.
Installing Netdata in Kubernetes
The process to install Netdata in Kubernetes is fairly straightforward. You need to:
- Add the helm repo and update
- Issue the helm install command for Netdata
Add the helm repo and update
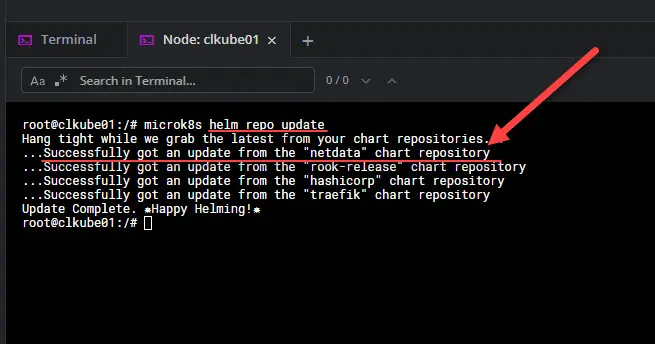
The first thing you need to do is add their helm repo to your cluster:
helm repo add netdata https://netdata.github.io/helmchart/Once you have added the helm repo, run a helm repo update:
helm repo updateIssue the helm install command for Netdata
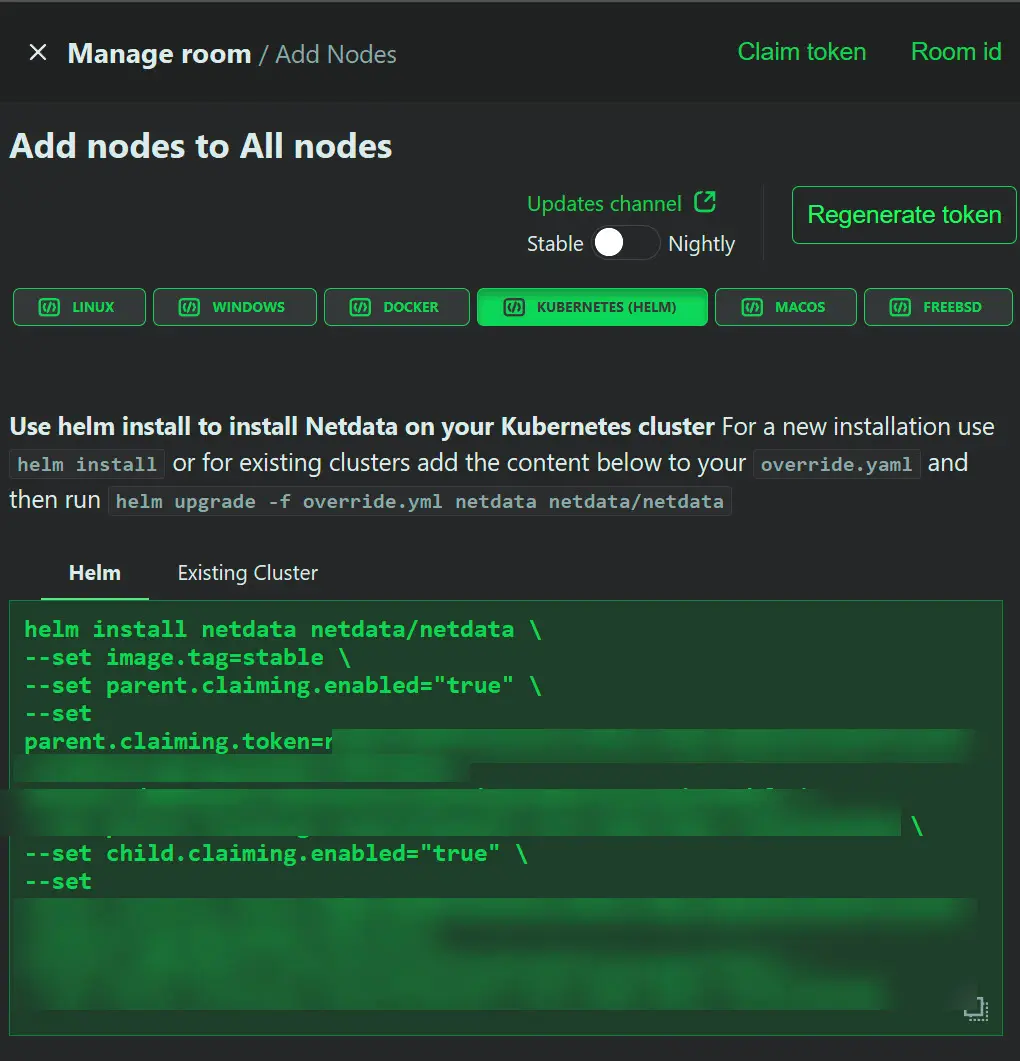
To install Netdata, you need to issue the helm install command that will look like the following:
helm install netdata netdata/netdata \
--namespace netdata \
--set image.tag=stable \
--set parent.claiming.enabled="true" \
--set parent.claiming.token=<your claim token from Netdata \
--set parent.claiming.rooms=<your room id> \
--set child.claiming.enabled="true" \
--set child.claiming.token=<additional claim info string> \
--set child.claiming.rooms=<your room id>
How do you get this information? Well, after you login to your Netdata SaaS dashboard, you can navigate to Nodes > Add Node and then select Kubernetes (Helm). The Netdata console will give you the helm command to install Netdata monitoring in your Kubernetes cluster. One detail though it doesn’t provide that I have shown above is adding the netdata helm repo. You will need to do that first before installing Netdata.
View Kube node metrics in Netdata and alerts
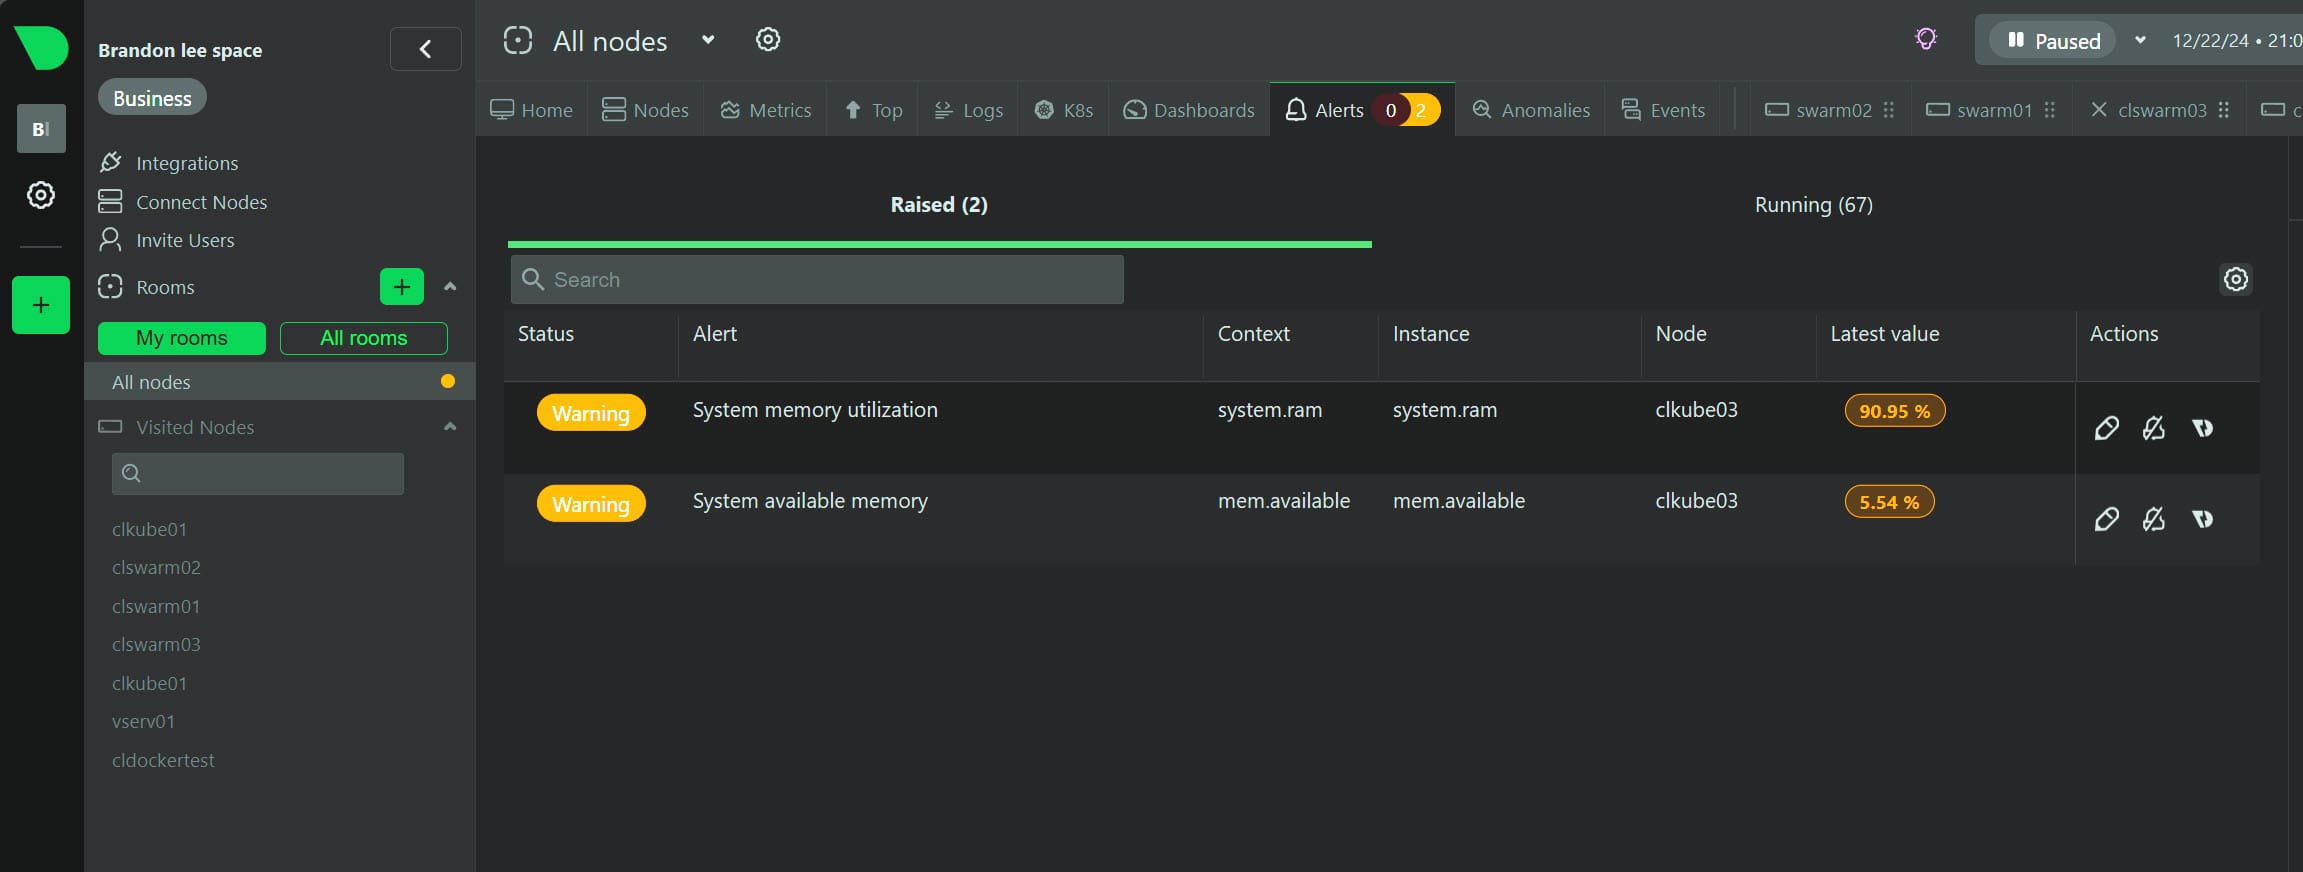
Now that we have the Netdata helm configuration installed in our cluster, we should be able to login to the SaaS dashboard and start to see the metrics streaming into the dashboard. This is one of the really great things you will appreciate about Kubernetes monitoring with Netdata. The time to get up and running with valuable metrics from your Kubernetes cluster is very short.
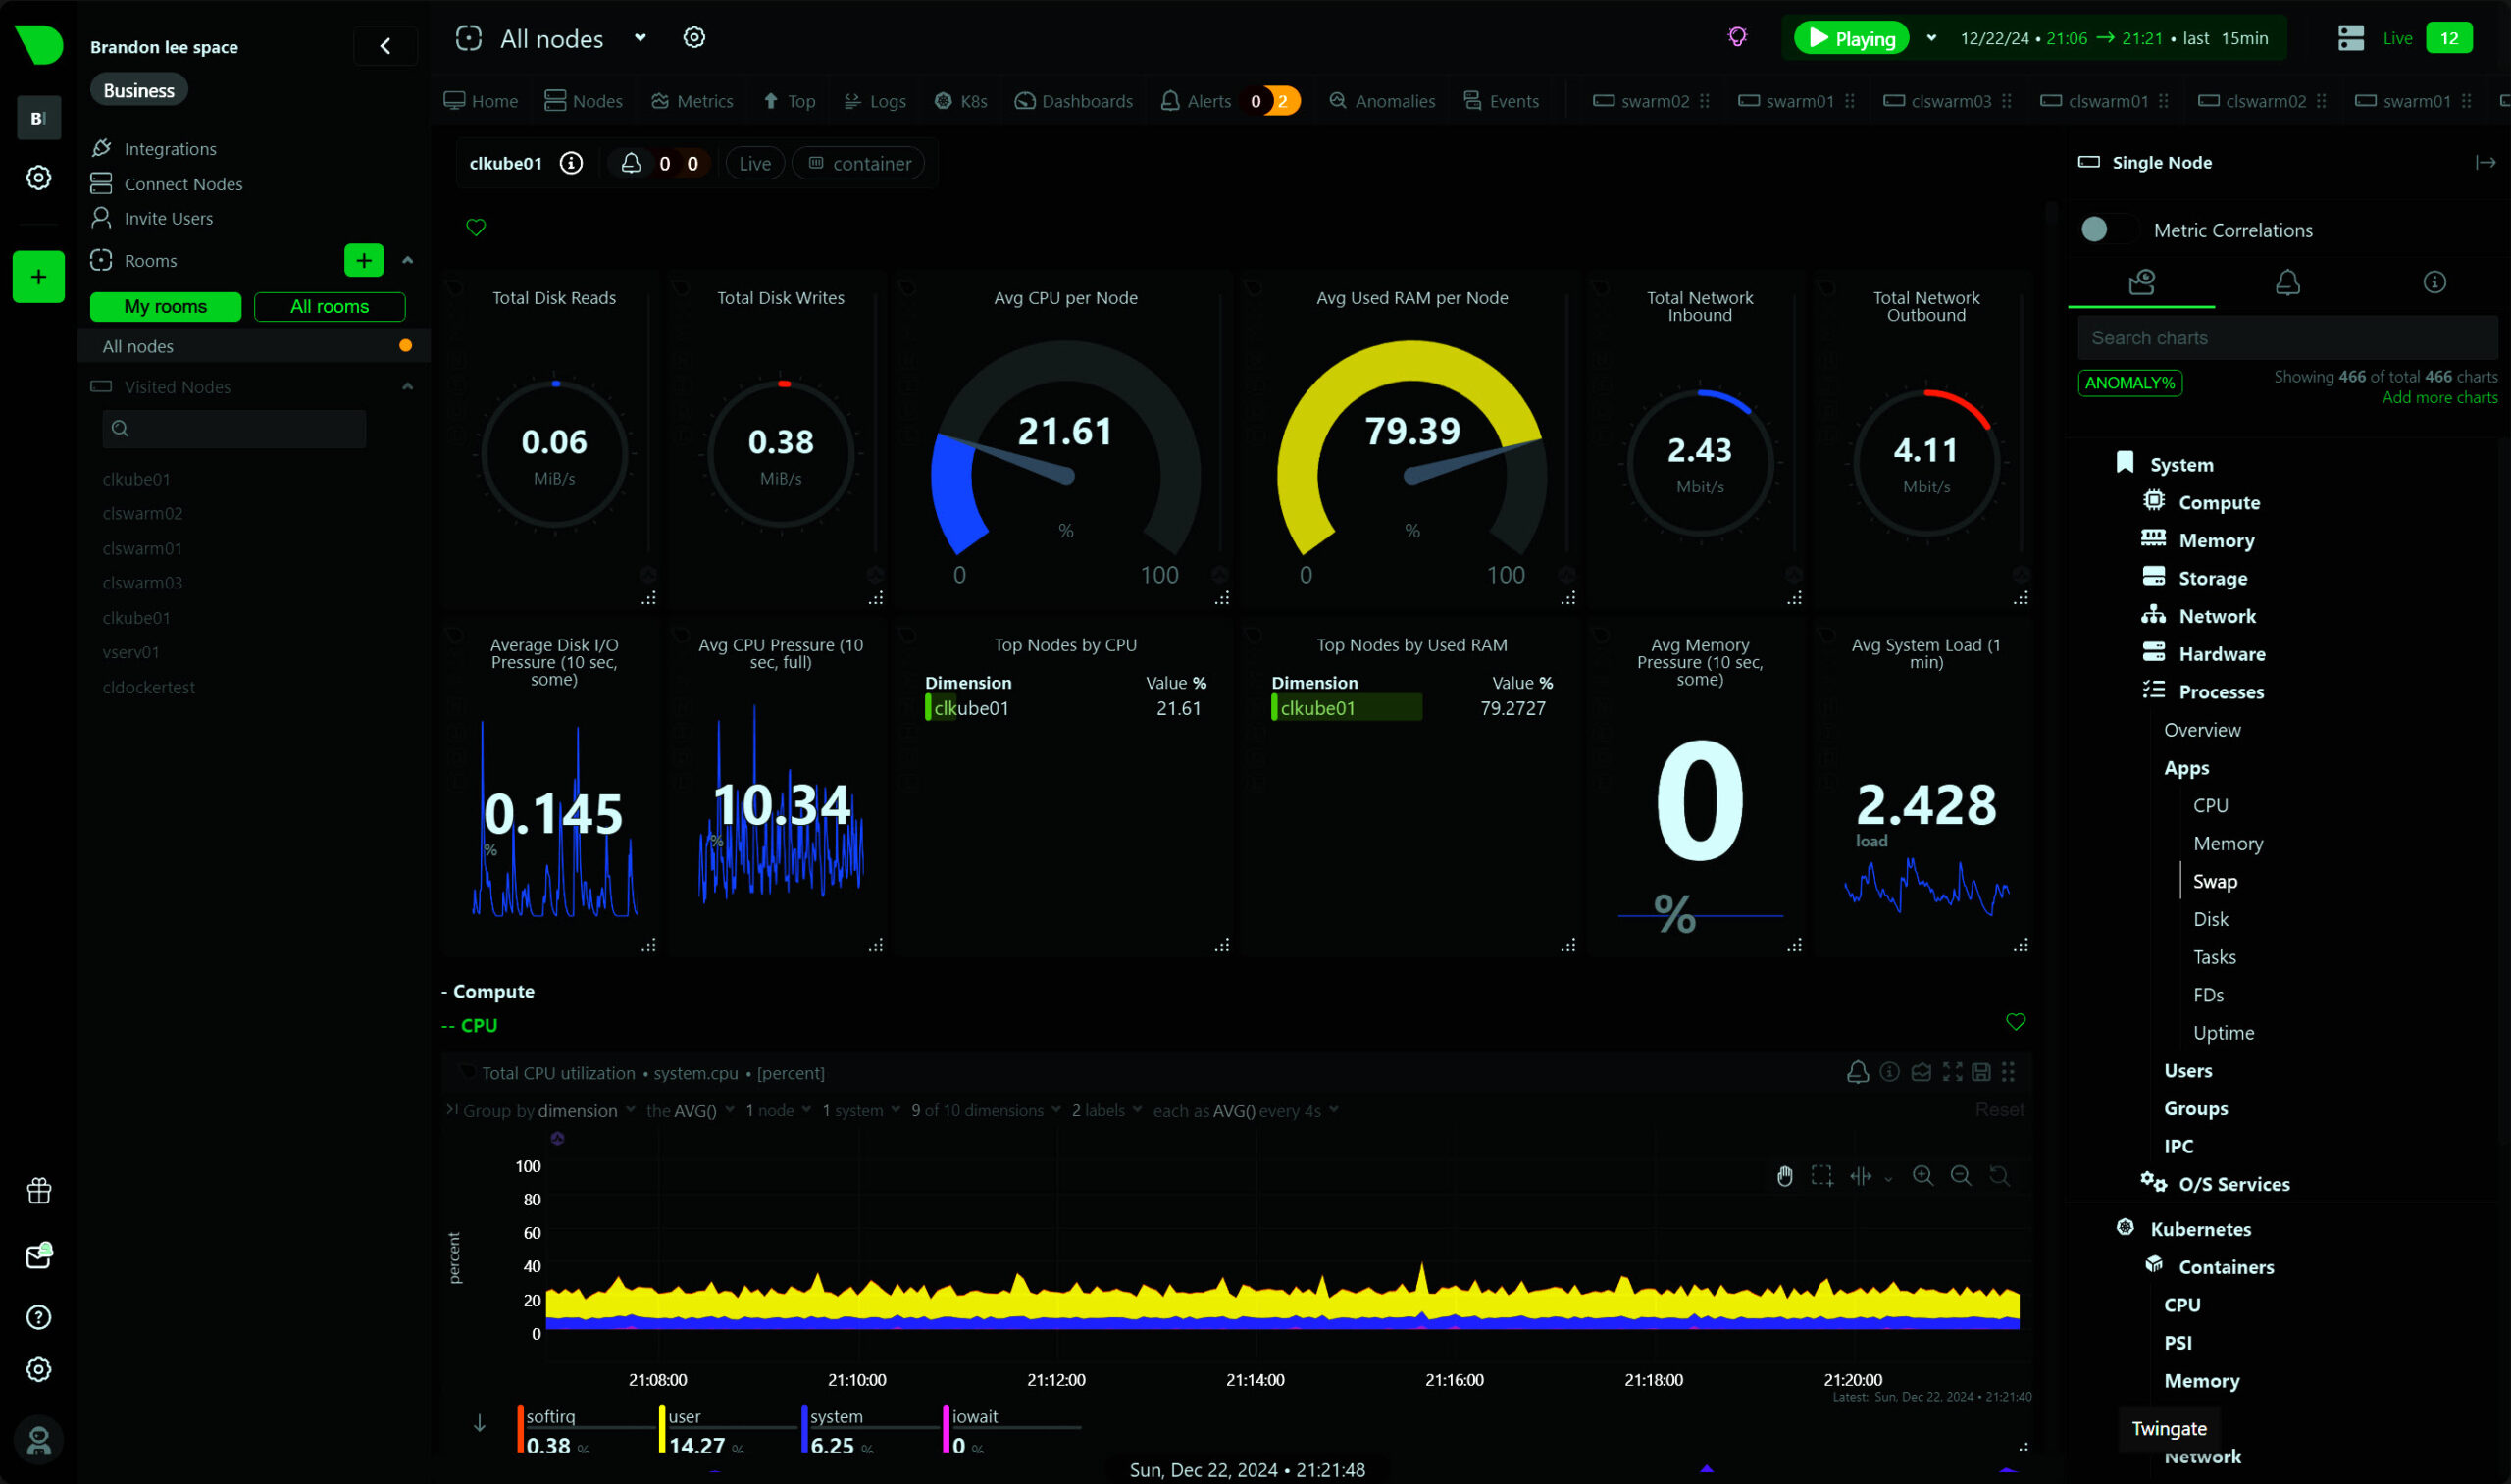
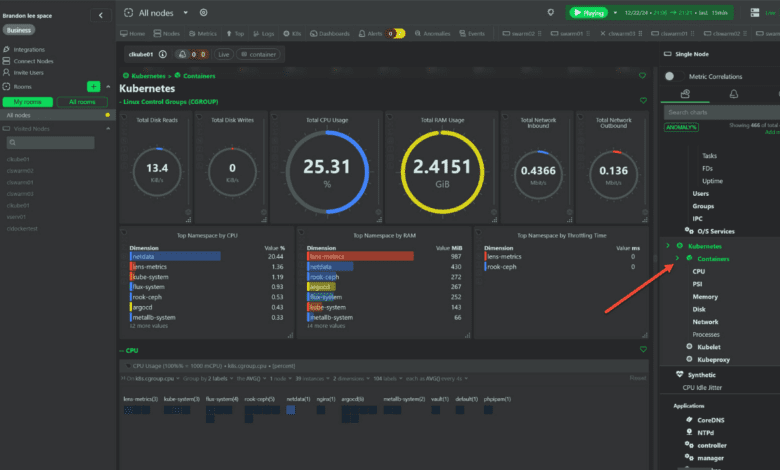
Below is the Kubernetes > Containers view. You can see the valuable information you get here like:
- total disk reads
- total disk writes
- total cpu usage
- total RAM usage
- total network inbound
- total network outbound
- top namespace by CPU
- top namespace by RAM
- top namespace by throttling time
Below is an example of the default monitoring you will have immediately after onboarding your cluster. Instead of having to start from scratch, you will automatically get monitoring of vital metrics of your nodes. You will see things like RAM monitoring of your nodes that are configured by default.
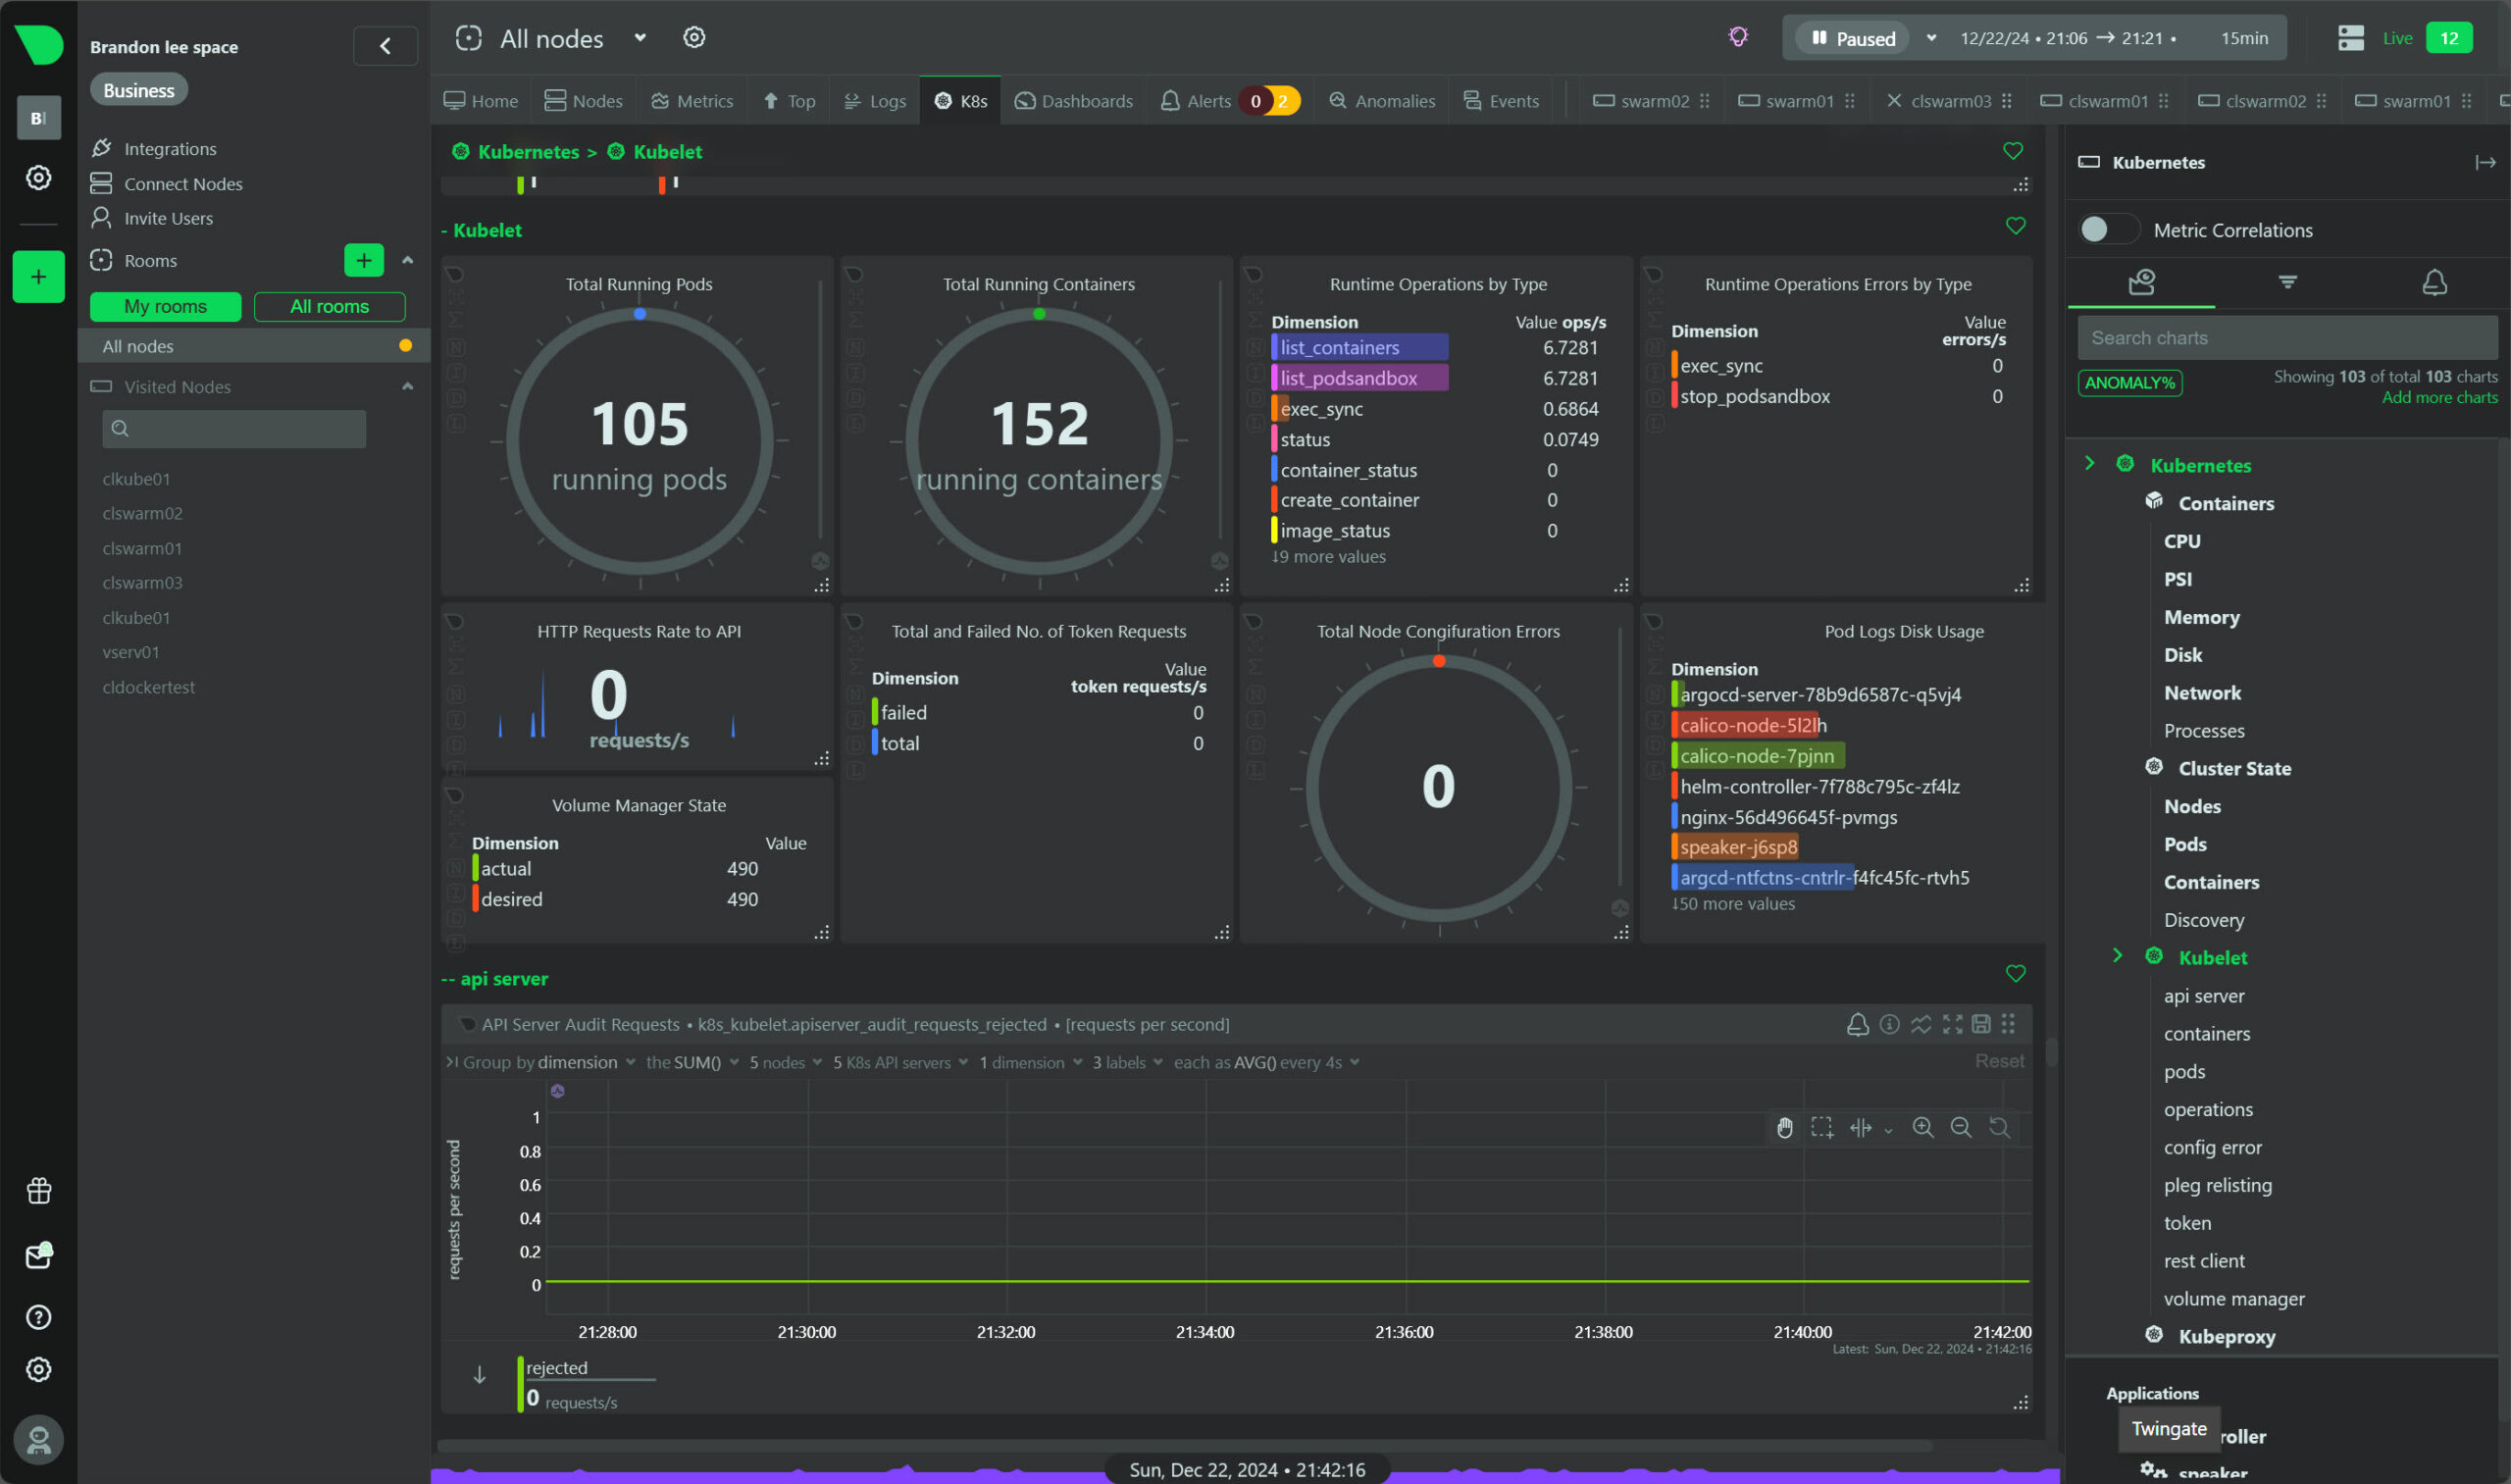
You will see very detailed information about the kubelet as well. You can see:
- total running pods
- total running containers
- http requests rate to API
- total and failed no of token requests
- runtime operations by type
- runtime operations errors by type
- pod logs disk usage
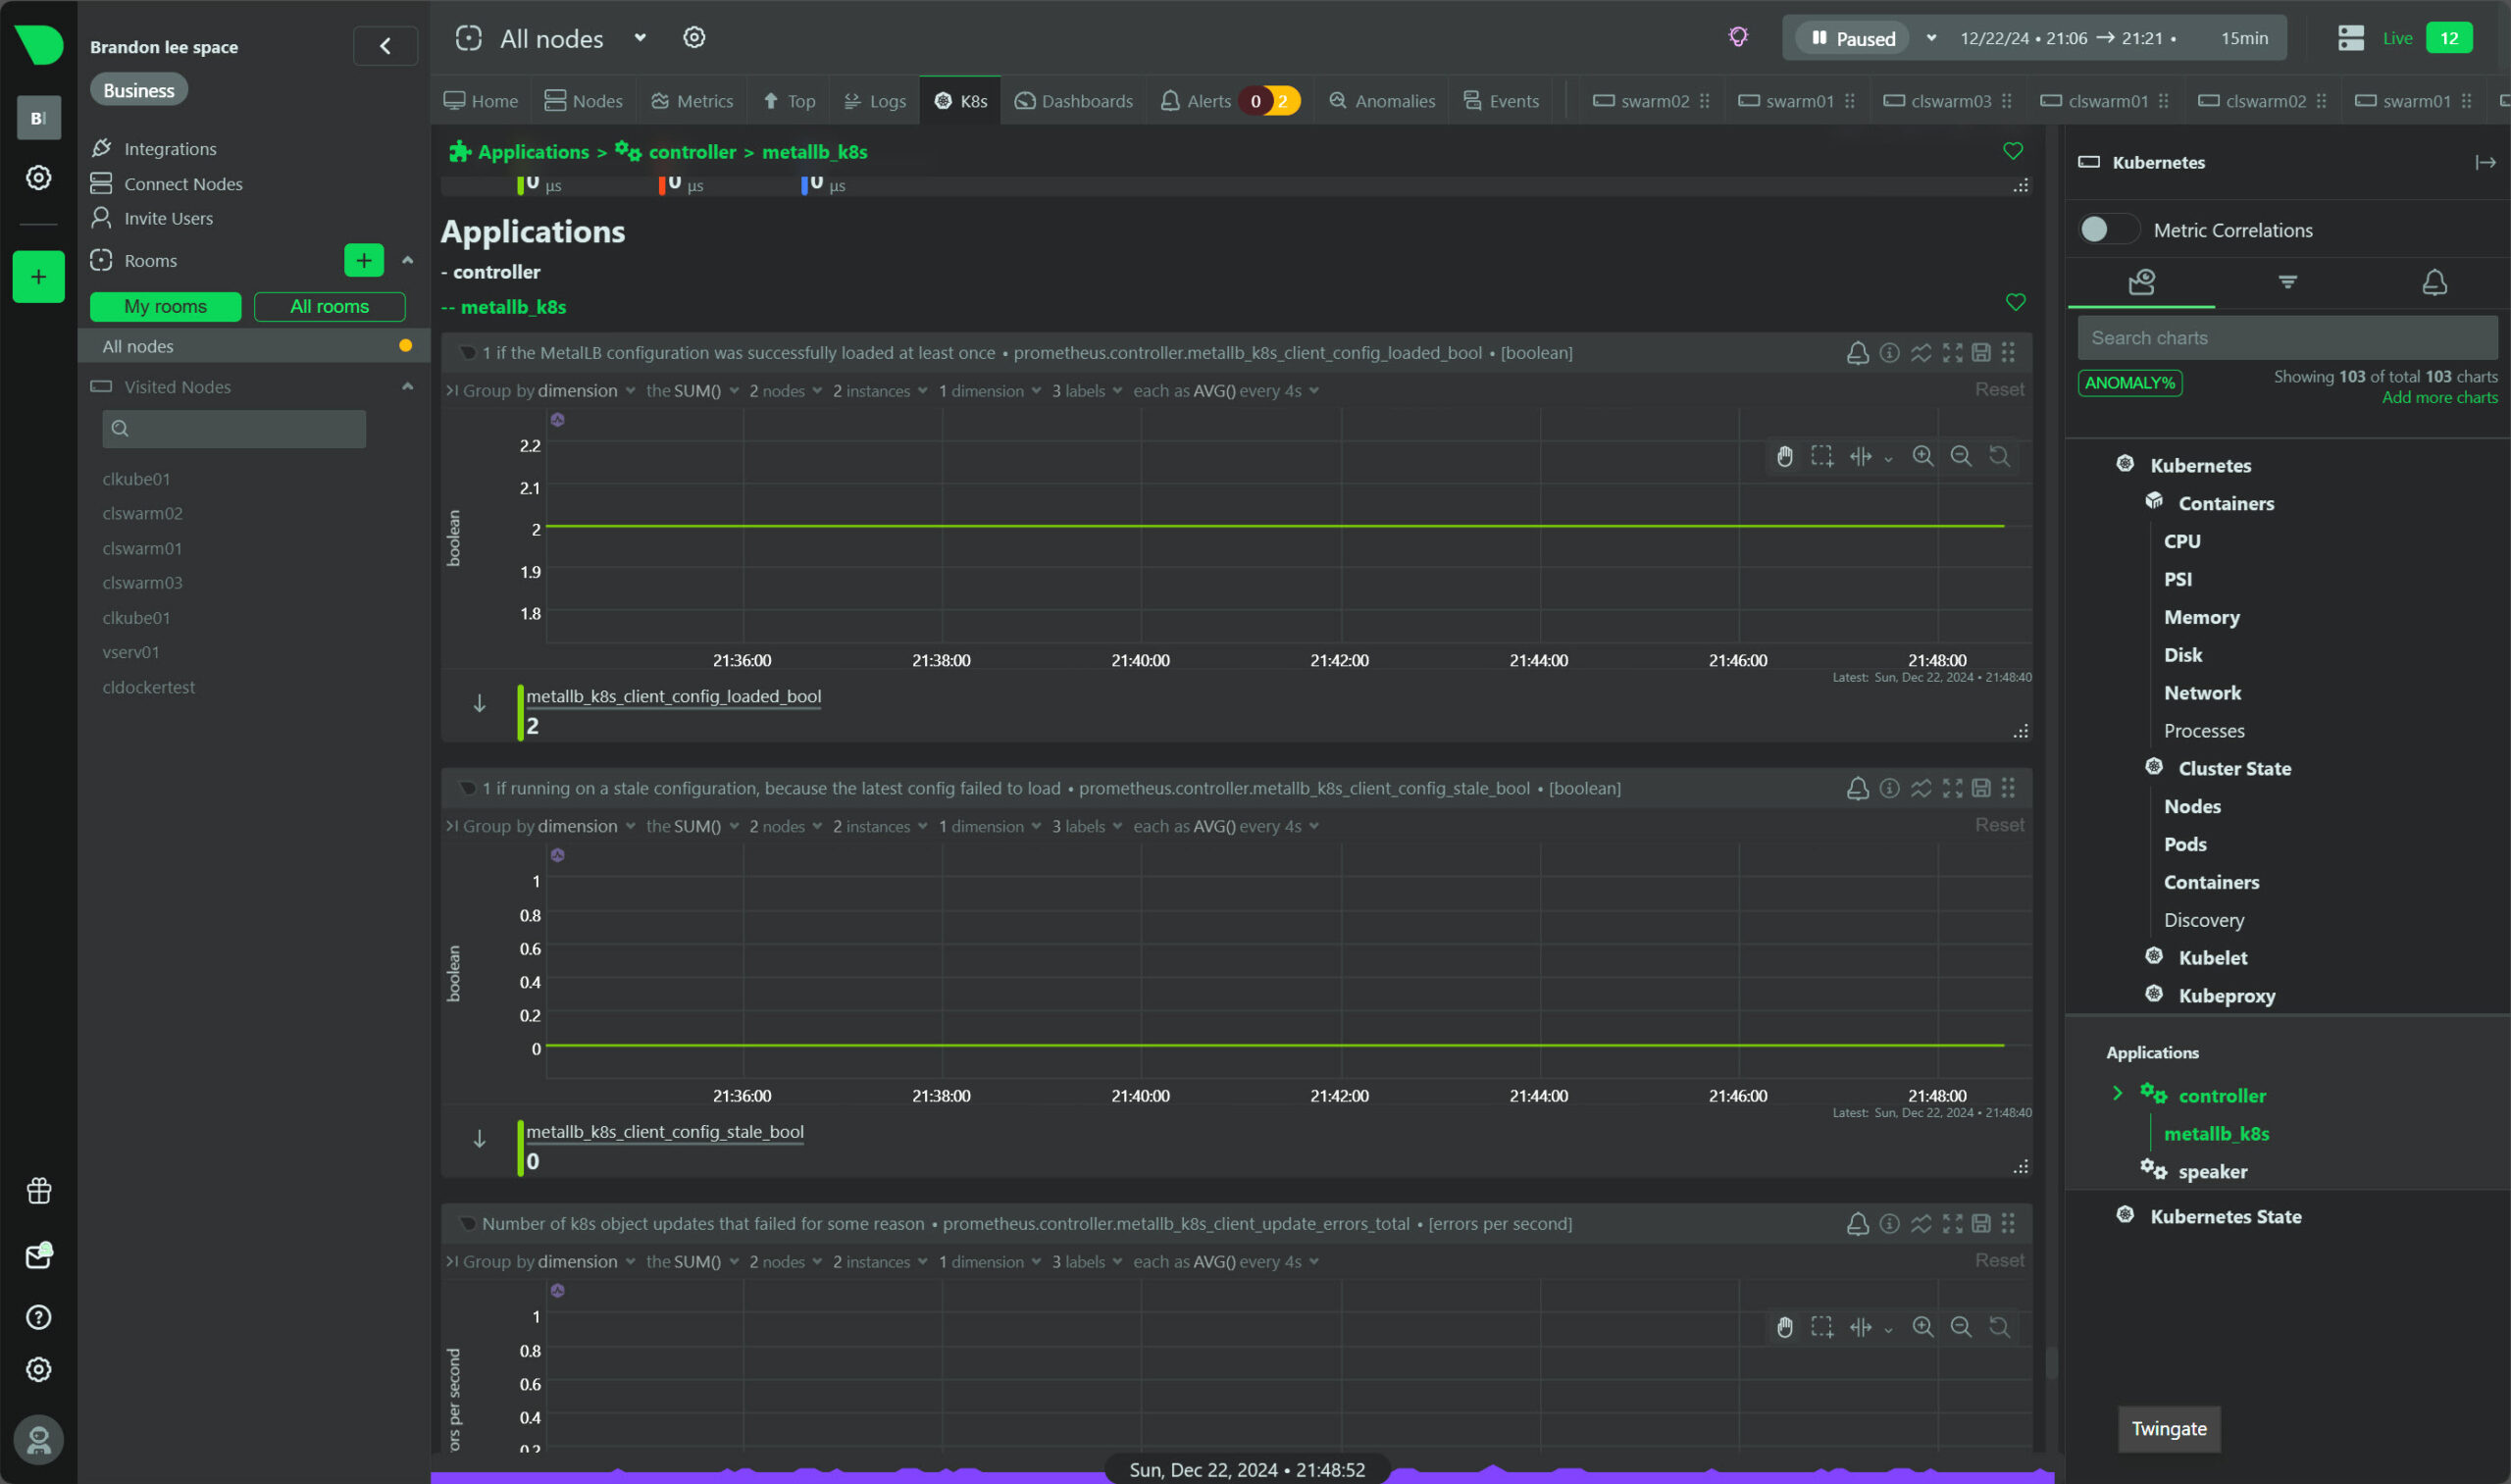
Applications showing things like MetalLB running in my cluster.
Home lab license
Also, of interest for those running home lab, Netdata has a home lab license that can be purchased for $90 a year for unlimited nodes. If you are like me and diving into containers and Kubernetes full on, having a way to effectively monitor your Kubernetes cluster is a great way to keep an eye on your modern applications running in your K8s cluster.
Wrapping up
I have been testing and using Netdata for a few months now and I can say that I am impressed with its features and capabilities. It takes the often tedious task of onboarding devices in an environment and setting up alerting extremely easy, which it should be.
However, a lot of traditional monitoring solutions make this step difficult and you have to spend days setting up your initial monitoring and alerting. While some may prefer starting from scratch with everything, I really like solutions like Netdata that allow you to hit the ground running. Let me know if you have tried out monitoring your kube node metrics with Netdata.

