I have been trying out Netdata monitoring for the past few weeks now and I can say that it is a super simple solution to get up and running with quickly. So, it is a quick win in home labs or production environments for getting an eye on important metrics. One of the drawbacks of the solution until recently was the lack of native Windows support. However, that has changed with Netdata 2.0. Let’s take a look at Netdata 2.0 and the new native Windows support among other new features.
Table of contents
Brief overview of Netdata
Netdata is a tool that provides real-time monitoring of performance and other metrics for infrastructure. It can monitor hardware, apps, containers, networks, and other things. It is available as a free and open source solution but it is also available as a SaaS solution hosted at Netdata.
One thing I like about Netdata is the fact that it automatically gives you access to the metrics that matter for most infrastructure. In many monitoring solutions, you have to start with a clean slate and build everything. While there are some advantages possibly to that, sometimes, it doesn’t really allow you to hit the ground running.
Netdata also has a lot of built-in alerts that automatically alert you on most of the metrics or other data that you would want to be notified of, which is extremely helpful.
Native Windows Support
I think the really big news with this release is the native Windows support in Netdata 2.0. Previous to this release, Netdata was not natively supported with Windows, so the Netdata 2.0 release has been reworked to make it a native environment.
The following is a blurb from the release notes for Netdata 2.0:
“While we continue using MSYS2 for certain POSIX dependencies, we’re making strides toward full abstraction of this layer. The Windows codebase is fully open-source, offering users complete functionality on Windows with no additional dependencies. Note that access to Windows systems via the Netdata UI requires a Paid Netdata Cloud subscription.”
Note the following points related to the new Windows installer:
- Windows Installer: The new Netdata 2.0 Windows installer package will make it easy to get up and running with Netdata.
- System Monitoring: With this native support, you can pull metrics for Windows systems. Metrics you can gather include CPU usage, memory statistics, network performance, and disk usage. These metrics can help narrow in on performance bottlenecks and help manage and troubleshoot your Windows resources.
- Application Monitoring: Netdata’s Windows support also allows you to capture application-specific data for services like IIS, MSSQL, and Hyper-V. For example:
- IIS (Internet Information Services): Netdata can do real-time monitoring of IIS. You can see request rates, error rates, and response times, enabling administrators to identify any issues that may be going on with IIS web services that may be impacting your web apps
- MSSQL (Microsoft SQL Server): You can see database performance metrics with Netdata Windows monitoring, including query response times, memory usage, and transaction throughput. This will help DB administrators troubleshoot performance iussues and any slowdowns.
- Hyper-V Monitoring: Netdata Windows monitoring has Hyper-V integration. This provides metrics on virtual machine performance. It can also tell you how your resources are allocated, and more.
Advanced Process Monitoring: Dynamic Grouping with apps.plugin
In Netdata 2.0, process monitoring has also been part of an overhaul with dynamic process grouping using the apps.plugin. What is this feature? This feature auto-groups processes and helps reduce the need for manual setup. This process before was often time-consuming and prone to human error in earlier versions.
- Dynamic Grouping: The
apps.plugincan now automatically detect and group related processes instead of these having to be defined manually. This is especially useful for managing large environments that may have hundreds or thousands of processes. It makes it where you have a well-organized, real-time view of process activity without complex configurations. - Managing Complex Application Stacks: Netdata can automatically group processes related to web services, databases, and caching servers as an example in a web services environment. This grouping allows you to view the overall impact of each component on system resources. It helps them quickly identify problems without going through each individual process.
Installing the Netdata 2.0 Windows installation
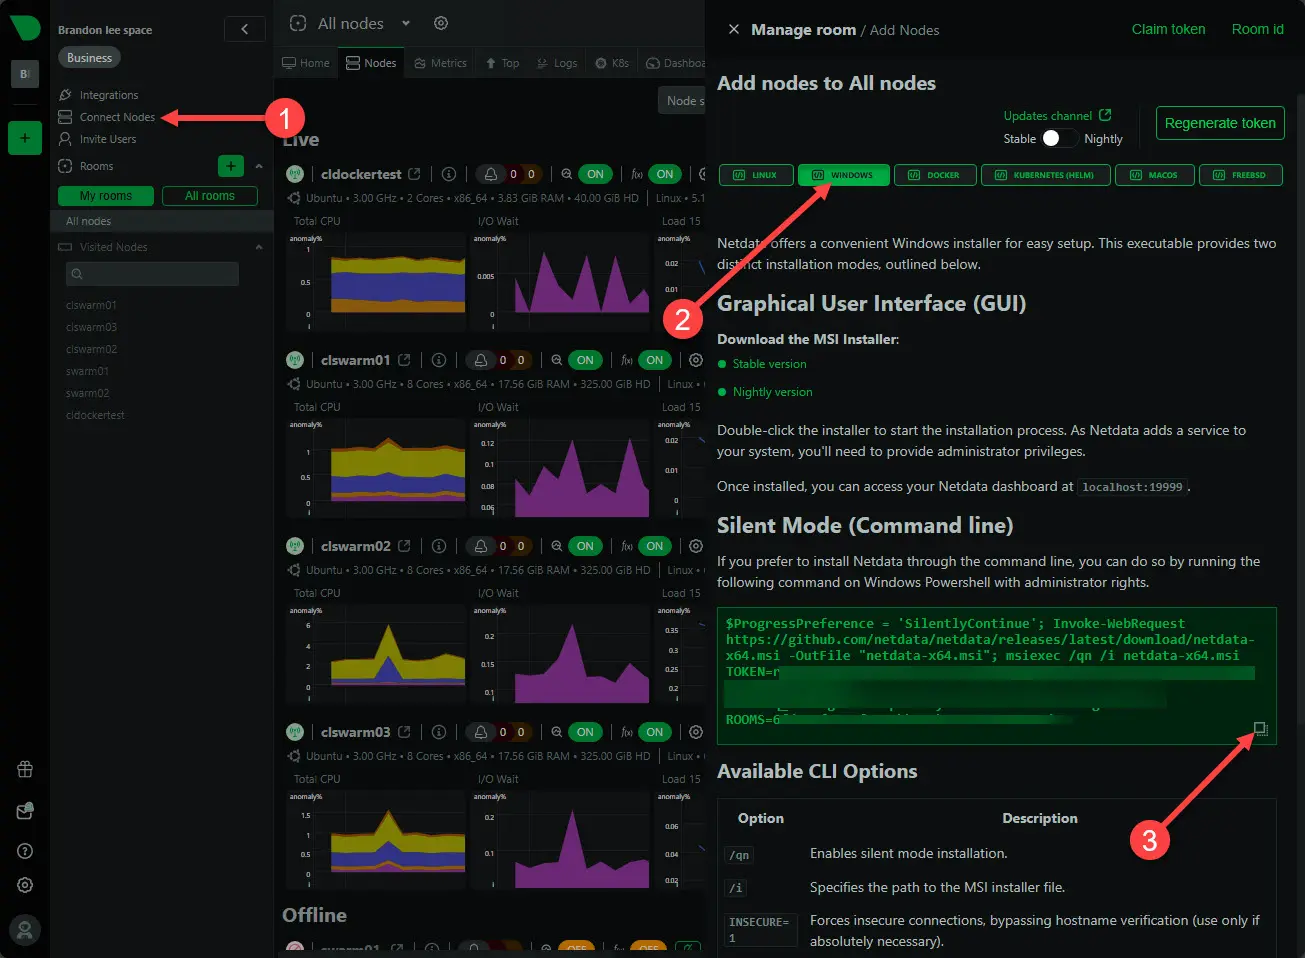
I wanted to give you an overview of the Netdata 2.0 installation in Windows. When you login to your Netdata console, click on Connect Nodes > Windows > copy icon. This is copying the silent installer which is the easiest to run since you don’t have to download anything at all and then execute it manually. You will notice in the screenshot, there is a Graphical User Interface (GUI) section where you can download the stable and nightly releases and execute these with a graphical installer.
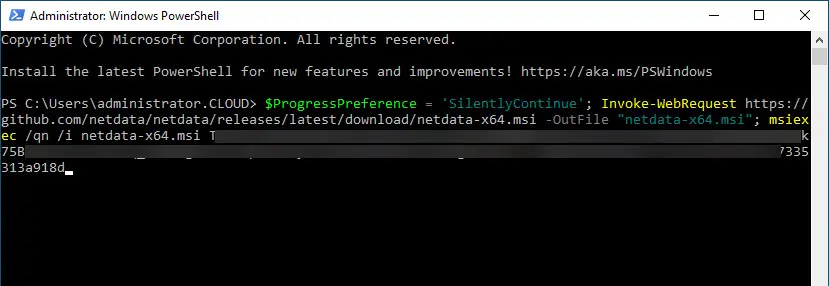
To me, the easiest method of installation is the silent command line. Just paste in the command, hit ENTER, and you are done.
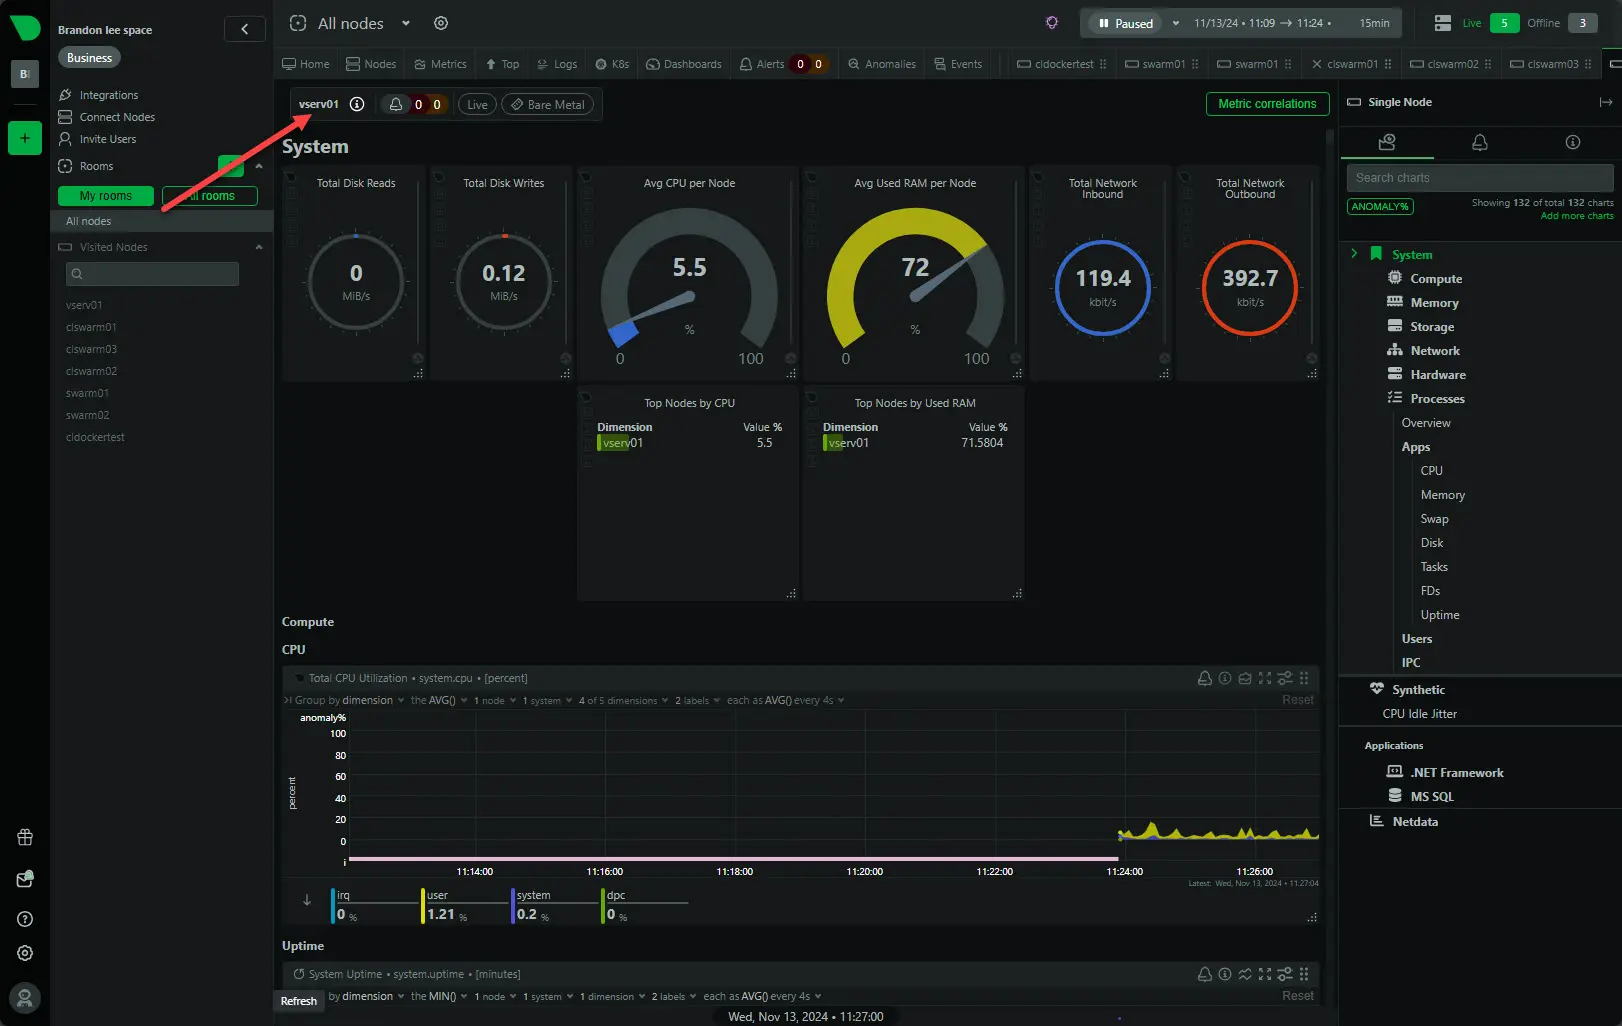
After just a few moments, I refreshed my nodes page and the server was there, already collecting metrics, very cool.
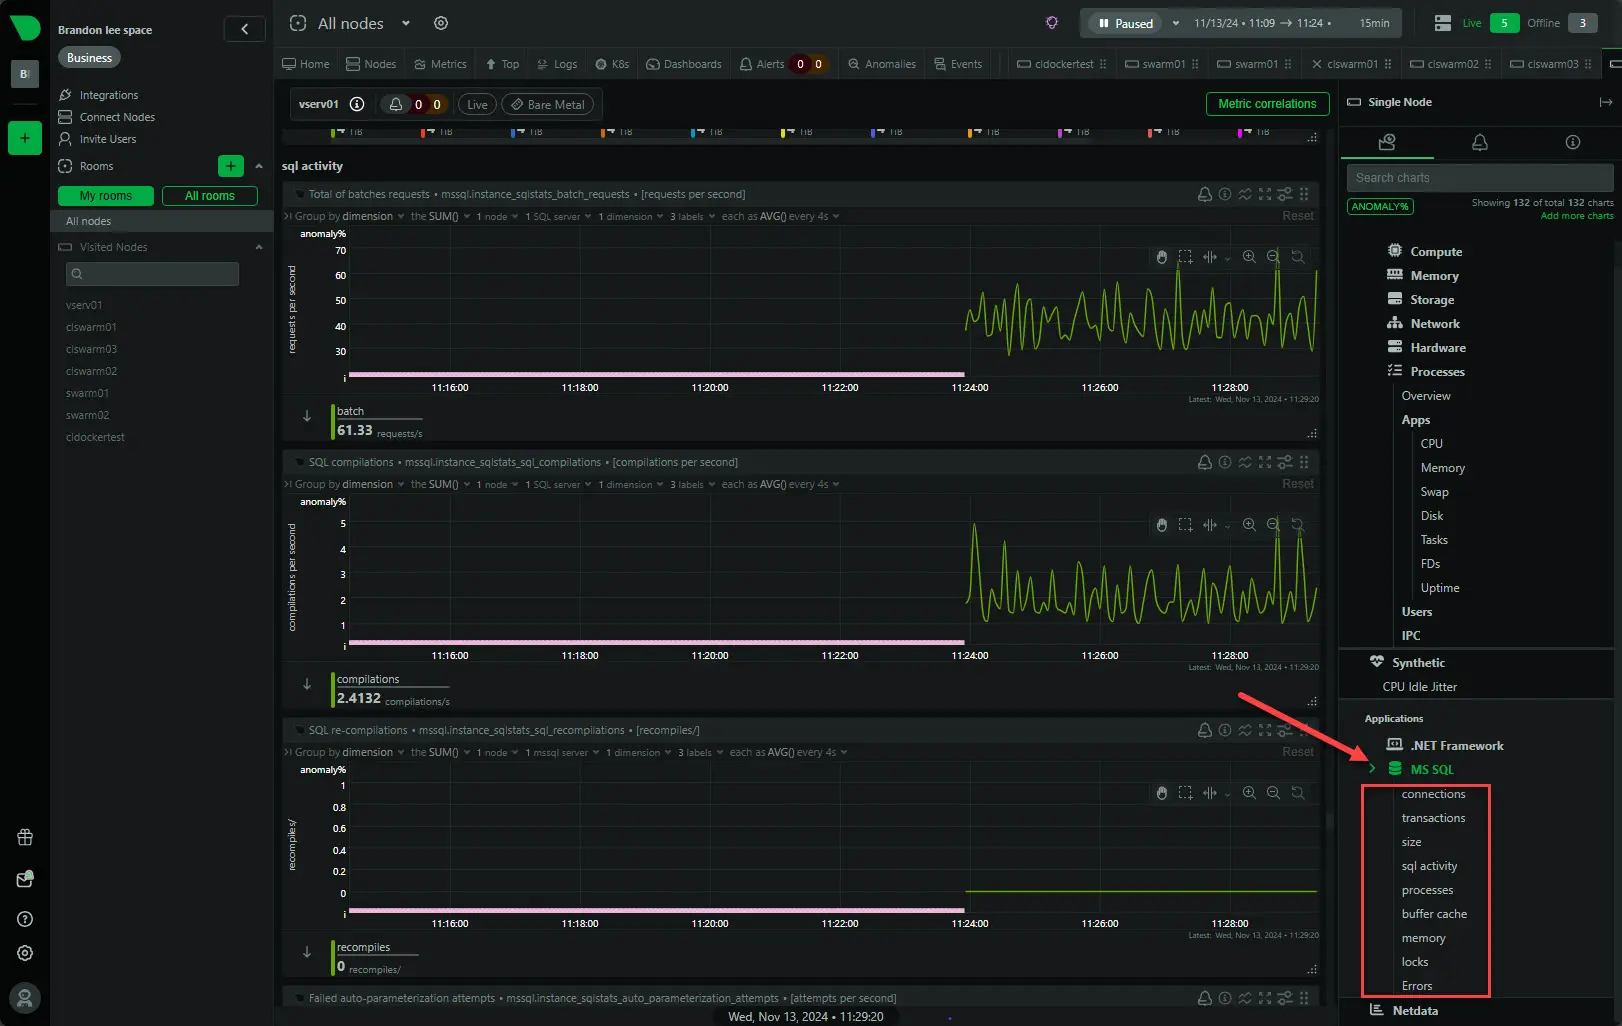
Netdata automatically recognized this Windows Server is a SQL server and detected it as an application. Automatically, without any setup, it gives you many different SQL statistics:
- Connections
- Transactions
- Size
- SQL activity
- Processes
- Buffer cache
- Memory
- Locks
- Errors
The new Netdata 2.0 functionality with native Windows support looks to deliver on that front with easy onboarding of Windows devices and automatic application detection and monitoring that is set up for you automatically. Very, very cool.
Improved SNMP Support and Connection Tracking
Aside from the native Windows support in Netdata 2.0, there has also been improvements with SNMP support and large connection volumes.
- Better SNMP Visualizations and Configuration: Netdata 2.0 makes SNMP support better by offering more detailed visualizations and an easier configuration process. It allows you to monitor network devices such as routers, switches, and firewalls.
- High-Performance Connection Tracking: Network environments that handle thousands of connections can now use Netdata’s improved connection tracking. It allows processing high volumes of network connections without performance impacts. If businesses have high-traffic networks or need to monitor the health of extensive networks with hundreds of devices, this improvement will be a welcome addition.
New API v3 and UI Enhancements
Netdata 2.0 includes a new version of its API and a refreshed UI. These improvements are targeting providing a more streamlined experience and better flexibility for developers.
- API v3: The updated API v3 consolidates previous versions and capabilities. This will make it easier to access data and build custom integrations. This will help future-proof things and make sure that as Netdata continues to evolve, integrations will remain intact and undisrupted.
- UI v3: Netdata has a new UI v3 that is standalone and an installable package. This will give users the flexibility to deploy and update the UI independently of the backend. The UI has been redesigned to provide clearer data visualizations.
Security and Performance Improvements
Netdata has introduced some quality of life improvements in terms of security and performance with Netdata 2.0.
- Optimized Data Collection: Netdata has fine-tuned its data collection process that will help to lower CPU and memory overhead. This will be helpful in environments with high-performance systems that need to be monitored where performance impacts need to be at a minimum.
- Improved Security: Netdata 2.0 has many new security improvements. These include updates to address known vulnerabilities and a better permissions model. These will help to protect sensitive monitoring data from falling into the wrong hands.
Wrapping up
The new Netdata 2.0 release really shines with the native Windows monitoring introduced in this release. Now, onboarding and monitoring your Windows hosts is as easy as Linux with a simple, silent installer that can be run from the command line. In my testing this works really well. I also really like how Netdata does a lot of the heavy lifting with monitoring for you by automatically detecting applications and adding the monitoring sensors for you for these nodes, like Microsoft SQL Server and others. You can read the official release notes for Netdata 2.0 here: Release v2.0.0 · netdata/netdata.
Google is updating how articles are shown. Don’t miss our leading home lab and tech content, written by humans, by setting Virtualization Howto as a preferred source.

