In looking for upgrades to my home lab, one of the things that I wanted to implement was a kiosk type dashboard that rotated between different monitoring screens showing different statistics in the home lab. As it turns out, Raspberry Pi has a kiosk mode that you can implement with Raspberry Pi OS that allows easily creating a Raspberry Pi Wayland Kiosk for home lab dashboard setup to keep an eye on self-hosted services and create a custom dashboard with links to your web applications. In this tutorial, we will see how to set this up.
Table of contents
- Raspberry Pi Kiosk mode and Grafana
- Hardware requirements
- How to set up Grafana for monitoring?
- Setting up your Raspberry Pi
- Run updates on Raspberry Pi OS
- Install WTYPE
- Configure Raspberry Pi OS autologin
- Add Wayfire.ini file for Raspberry Pi Kiosk mode
- Switchtab.sh file
- Handling dashboard logins in Grafana
- What does it look like?
- Securing your Kiosk if needed
- Troubleshooting
- Inspiration for this project
- Wrapping up
Raspberry Pi Kiosk mode and Grafana
A Raspberry Pi makes a great solution for a home lab kiosk device since they are relatively cheap and are extremely power efficient if this is something you will have powered on and up 24/7/365. Wayland is the new display server in Raspberry Pi that moves away from the older X11 display protocol.
Wayland has better performance and efficiency, and it allows for simpler code implementation. We will utilize Wayland to implement a kiosk for home lab that will bounce between a few Grafana monitoring dashboards.
With Grafana, you can use a search function to quickly find and launch apps. You can also customize the default layout and appearance with editing the various panel configs to fit your dashboard and display certain widgets. You can find ready-made dashboards on the Grafana community dashboard site here: Grafana dashboards.
This allows you to monitor and keep a graphical check on your error log files as you can subscribe your dashboard to various displays and metrics.
Hardware requirements
There are a few hardware requirements to note before you set this up in your home lab:
- You will need a Raspberry Pi
- You will need an SD card or USB drive for the Raspberry Pi to boot from
- You will need a monitor for your kiosk
- Mini HDMI cable to HDMI cable on the monitor from the Raspberry Pi to the monitor connection
- Power cables of course for the monitor and Raspberry Pi
- Also, you may want a VESA monitor mount to mount your monitor to the wall like I have done in the below pictures
How to set up Grafana for monitoring?
Check out the following walkthroughs I have written that are helpful to setup Grafana and InfluxDB for monitoring:
- VMware Monitoring for Free with Telegraf InfluxDB and Grafana
- InfluxDB Grafana Docker-Compose Configuration: Proxmox Monitoring Example
This is just the start with Grafana. There are so many things that you can do with it and so many monitoring use cases. For the most part, if there is something you want to monitor, likely someone somewhere has created a dashboard for this purpose and you can find good examples of how to monitor your environment with it.
Setting up your Raspberry Pi
The first thing we need to do is set up our Raspberry Pi device. With Raspberry Pi, you can download the Raspberry Pi imager utility. You can find that utility here: Raspberry Pi OS – Raspberry Pi
Once you download the utility, you can then install Raspberry Pi OS onto your device of choice, like a microSD card or USB drive.
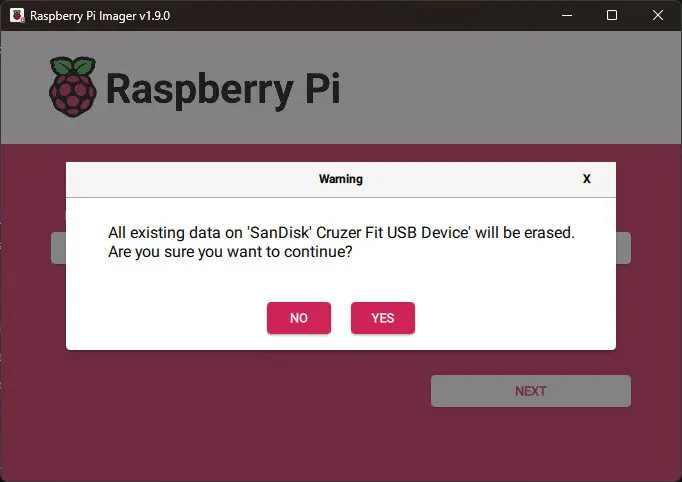
One of the cool things you can do with the Raspberry Pi imager is set the hostname, username, and password so that on the first run, you don’t have to configure these settings.
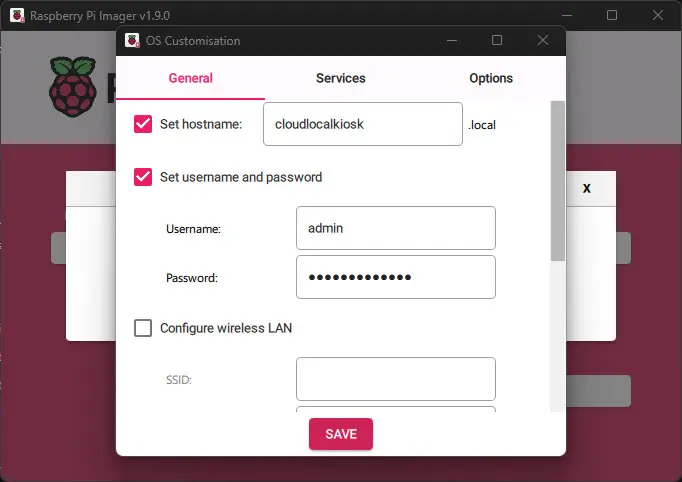
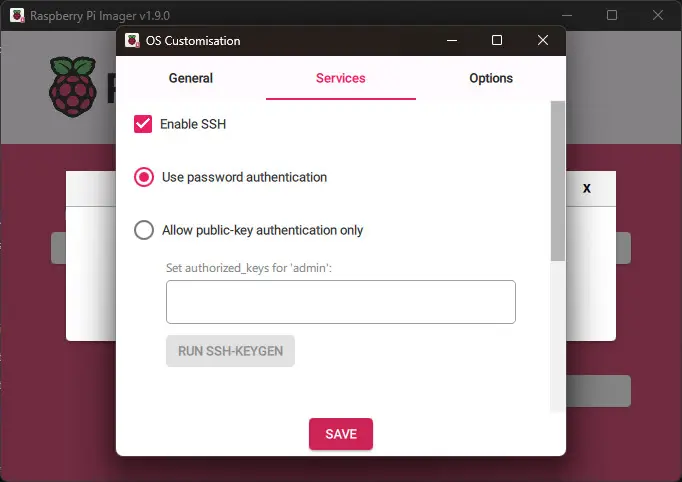
You can also pre-configure services like SSH connection, password authentication with SSH, or add public key authentication.
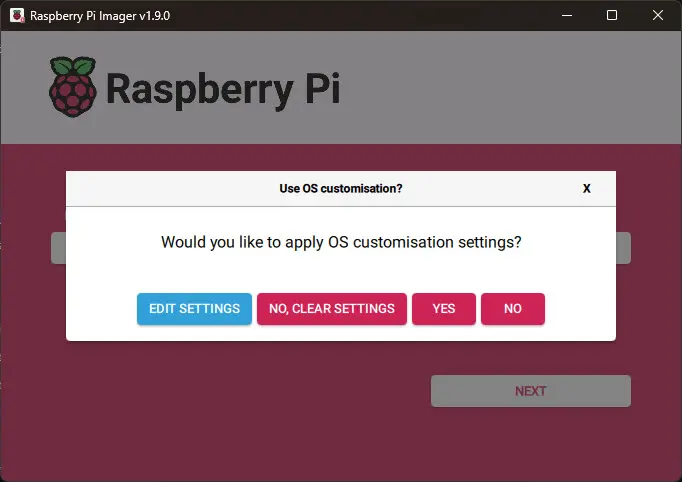
It will ask if you want to use the guest customizations.
Here I am imaging a USB thumb drive for my Raspberry Pi.
Run updates on Raspberry Pi OS
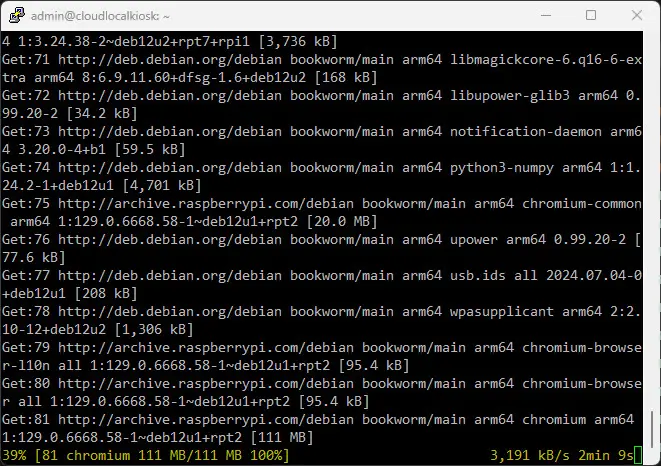
The first thing that is a good idea to do is run updates on your Raspberry Pi OS. To do that, open an SSH terminal, connect to your Raspberry Pi that will be used for kiosk mode and run the following command:
sudo apt update && sudo apt upgrade -yThis command will make sure all software and updates are applied to your Raspberry Pi operating system.
Install WTYPE
The next step we want to do is install a utility called WTYPE. This utility simulates keyboard inputs. We will need this installed as this is what we will use to tab back and forth between Chrome browser tabs to display different kiosk mode home lab dashboards that we want to have setup.
sudo apt install wtype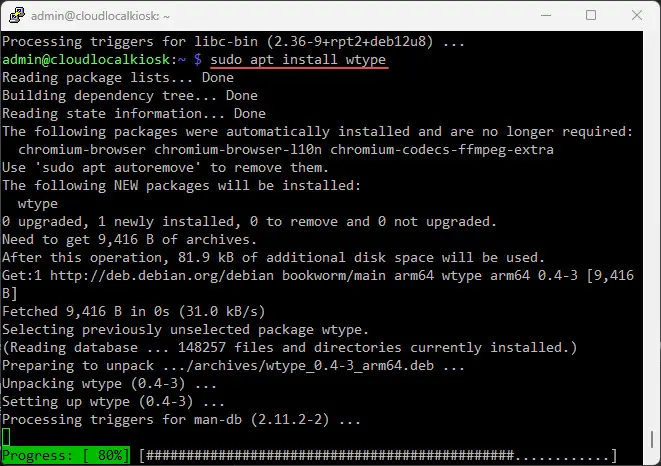
Configure Raspberry Pi OS autologin
The next thing we will want to do is configure the Raspberry Pi to be able to autologin. You want the Raspberry Pi to be hands off in kiosk mode so when you boot it up, you want it to start and then start displaying the home lab dashboard read outs that you have configured. So, you don’t want to be caught needing to input a username and password.
Using the raspi config utility, we can setup autologin for our default login that we setup during the installation process of Raspberry Pi.
raspi configType the command and press enter.
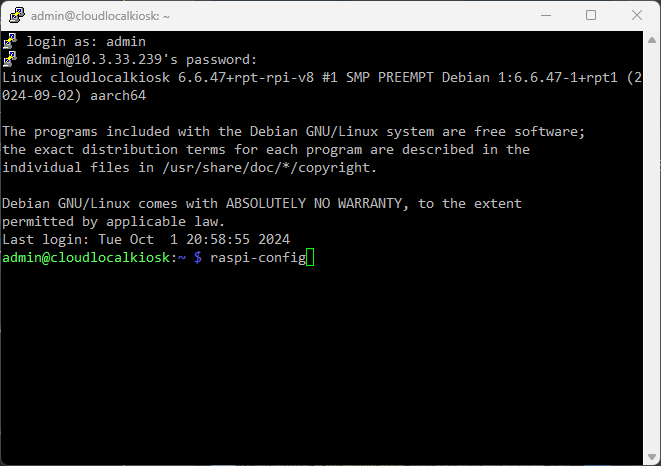
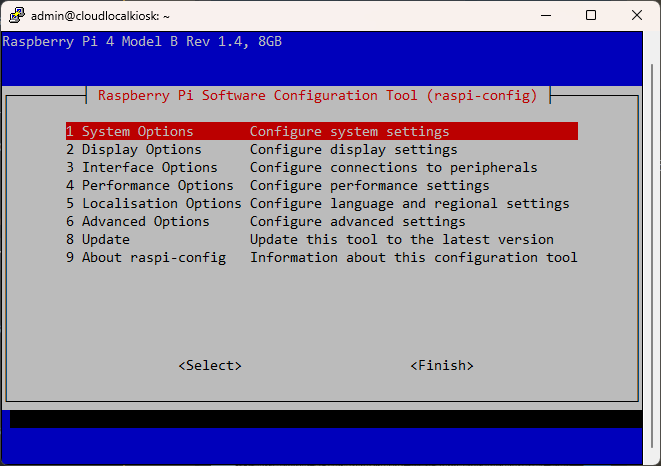
This will launch the Raspberry pi software configuration tool (raspi-config). Select System Options.
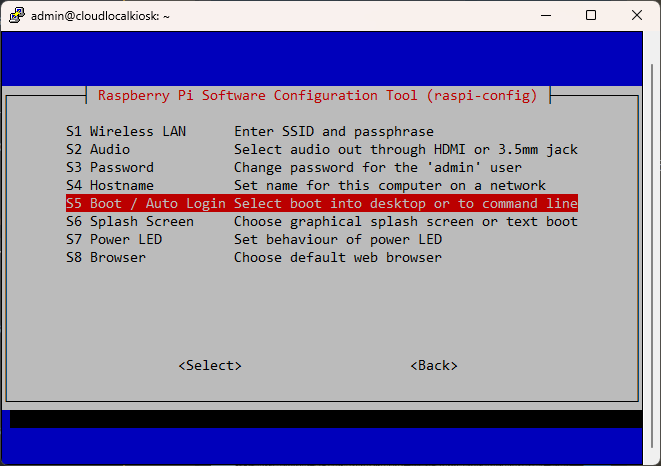
Next, choose Boot Autologin select boot into desktop or to command line option.
Select Desktop Autologin Desktop GUI, automatically logged in as <your username> user.
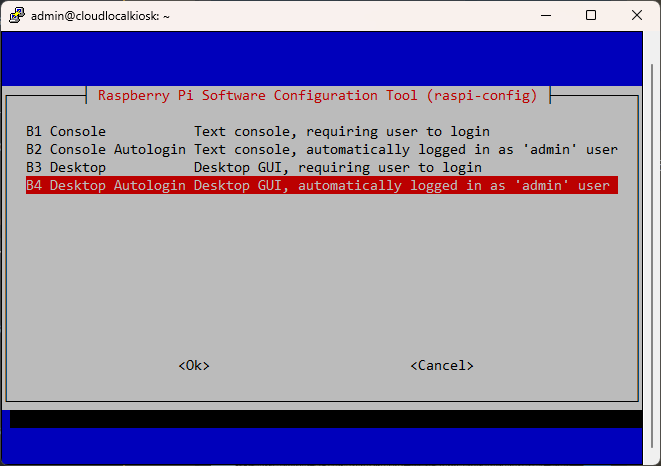
Tab down to OK and then Finish. At this point, it would be a good idea to reboot since we have made some changes and test the autologin configuration.
sudo rebootAdd Wayfire.ini file for Raspberry Pi Kiosk mode
To add the wayfire.ini file in your Raspberry Pi environment, navigate to the .config directory in your home directory.
cd .config
nano wayfire.ini
As an example, the wayfire.ini file contents will look like the following:
[autostart]
chromium = chromium-browser 'https://mygrafana.mydomain.local/d/dashboard?orgId=1&refresh=5s' 'https://mygrafana.mydomain.local/d/nr_QGP0iz/vmware-vsphere-datastore?orgId=1&refresh=5m' 'https://mygrafana.mydomain.local/d/kwtyVaAmz/vmware-vsphere-overview?orgId=1' --kiosk --noerrdialogs --disable-infobars --no-first-run --ozone-platform=wayland --enable-features=OverlayScrollbar --start-maximized
switchtab = bash ~/switchtab.sh
screensaver = false
dpms = false
Switchtab.sh file
As you can see above, the wayfire.ini file calls switchtab.sh script. The switchtab.sh file is created in the root of the home directory.
Below is the contents of switchtab.sh file in my environment. As you can see below:
- It navigates between different chrome tabs that are configured in the wayfire.ini file
- This is where you configure the sleep as well between tabs (how long the dashboard read-out stays on a specific tab)
Create the file and edit it to place the following:
#!/bin/bash

# Find Chromium browser process ID
chromium_pid=$(pgrep chromium | head -1)

# Check if Chromium is running
while
[
[ -z $chromium_pid ]]; do
  echo "Chromium browser is not running yet."
  sleep 5
  chromium_pid=$(pgrep chromium | head -1)
done

echo "Chromium browser process ID: $chromium_pid"

export XDG_RUNTIME_DIR=/run/user/1000

# Loop to send keyboard events
while true; do
  # Send Ctrl+Tab using `wtype` command
  wtype -M ctrl -P Tab

  # Send Ctrl+Tab using `wtype` command
  wtype -m ctrl -p Tab

  sleep 15
done
Handling dashboard logins in Grafana
One of the challenges I had at first was getting logged into Grafana. What I did was let the kiosk boot and auto launch the Chrome tabs. With a keyboard and mouse attached, I logged into each page as it showed the normal Grafana login prompt and then had Chrome “save password” so letting it store the password locally in the browser to access the dashboards.
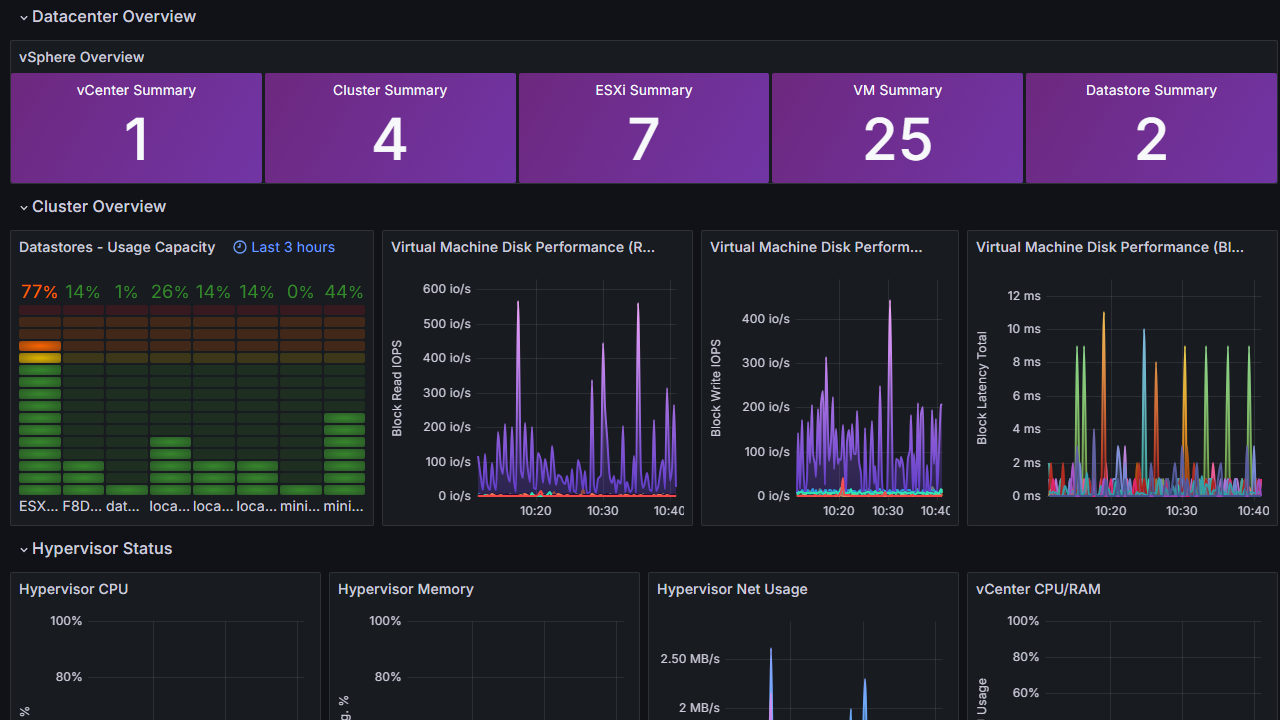
What does it look like?
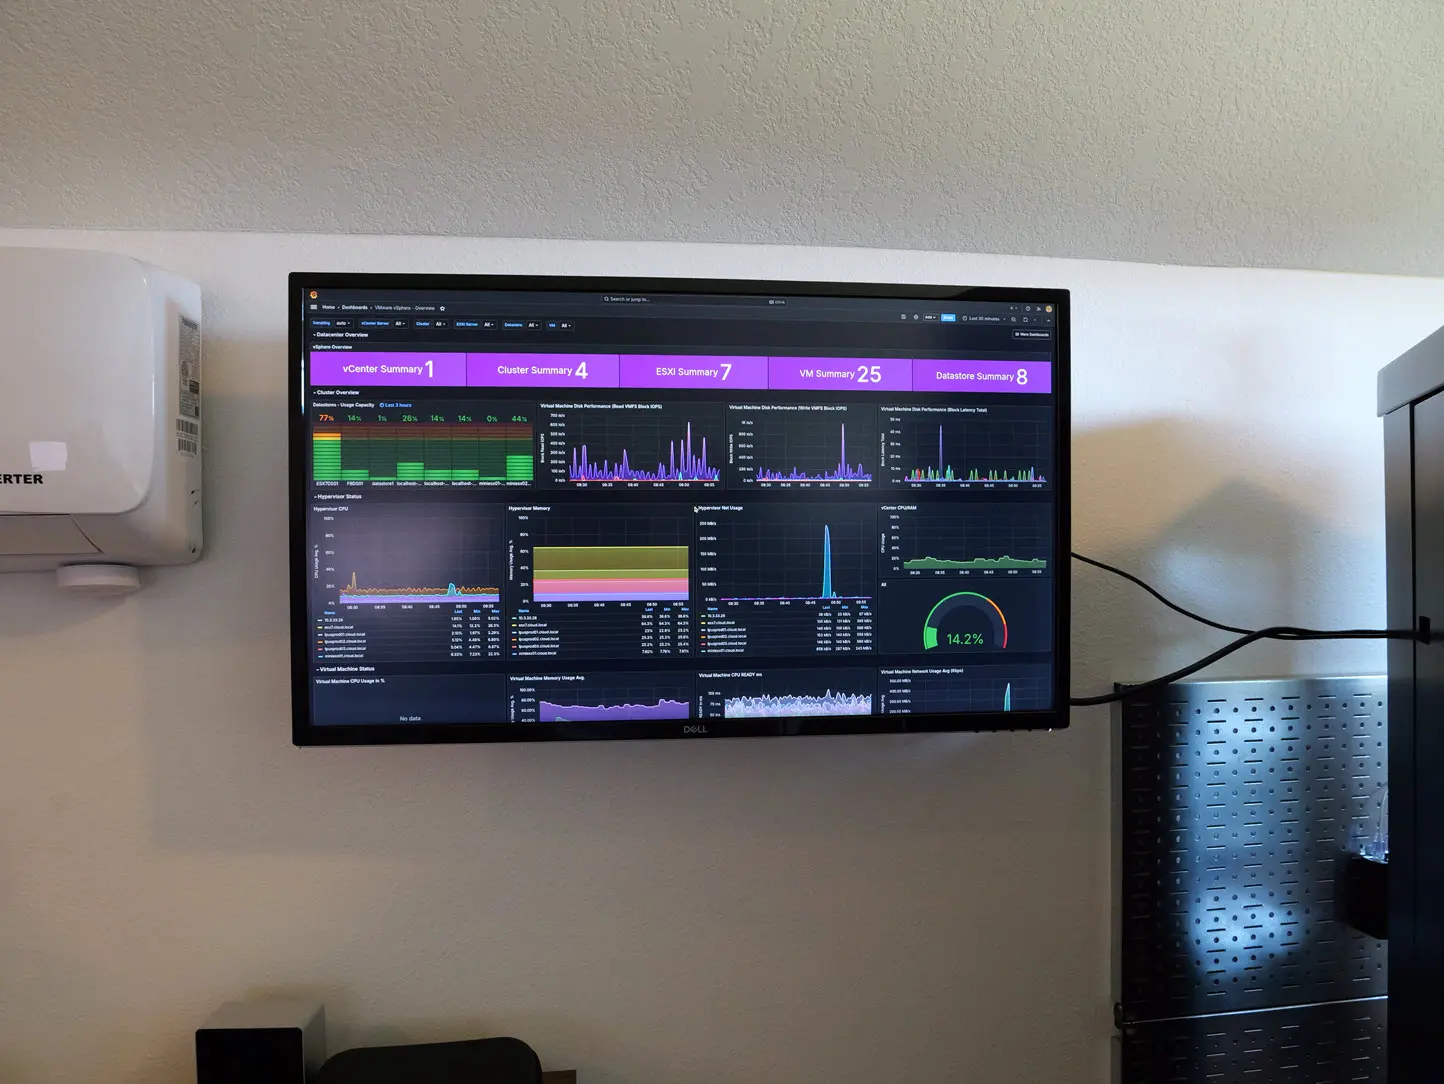
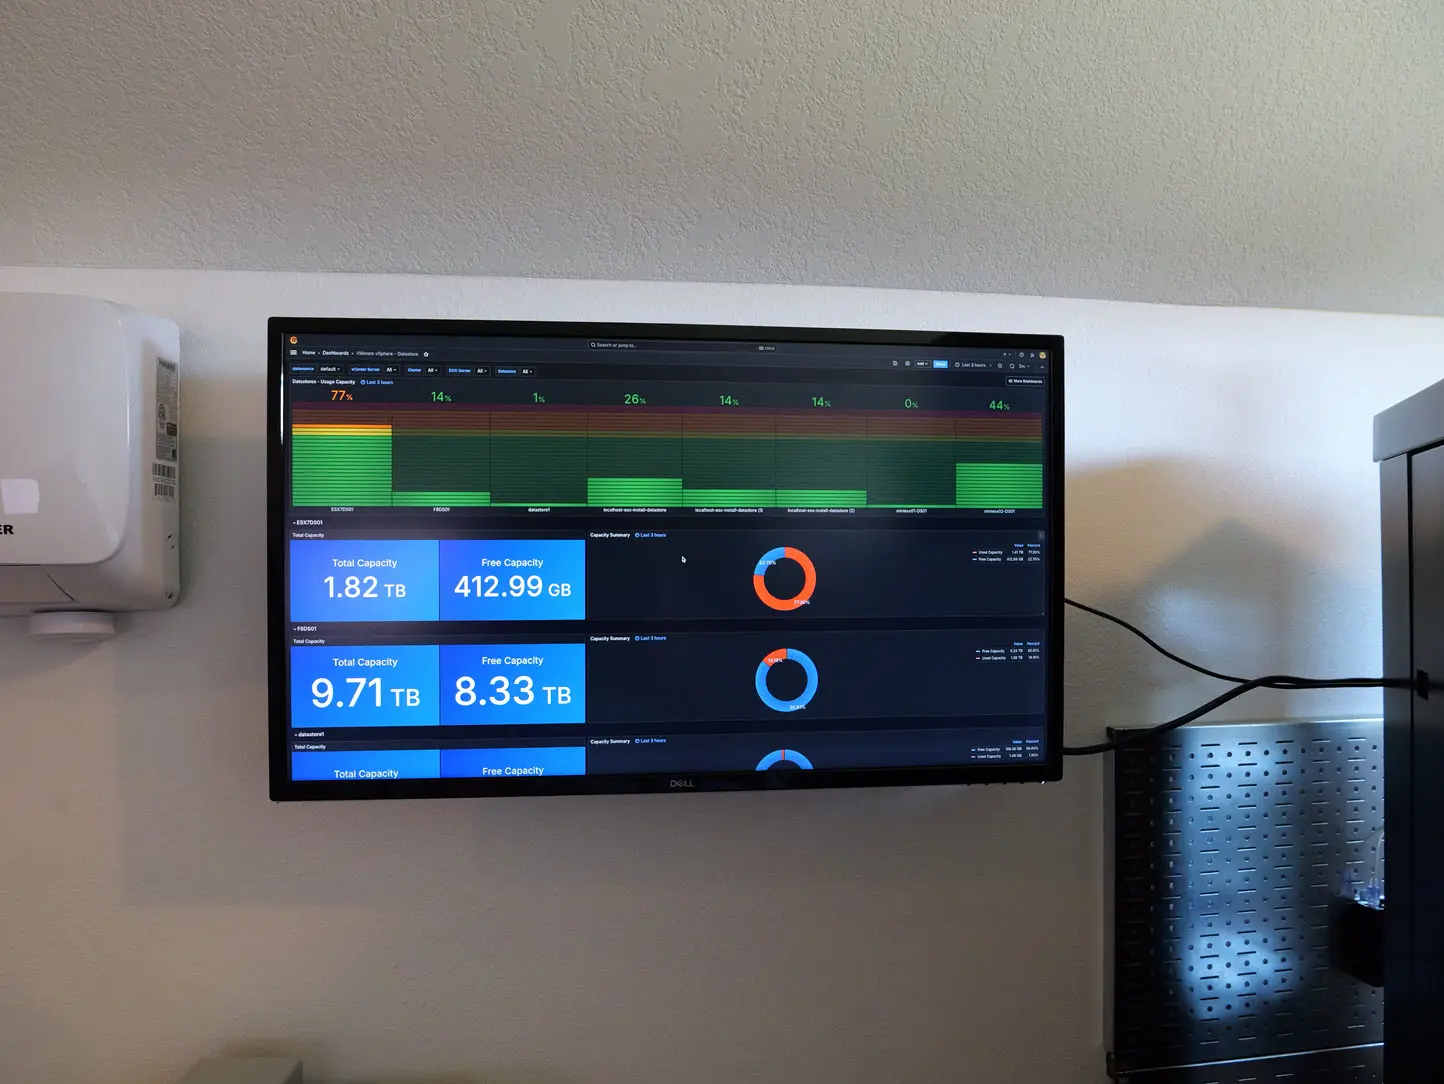
So what does the kiosk mode for the Raspberry Pi look like? Below are some pictures of the kiosk mode running on my Raspberry Pi pointed at some Grafana dashboards with a 32-inch Dell monitor. This first one is a vSphere summary.
Here is a weather dashboard I have built pulling from a personal weather station I run.
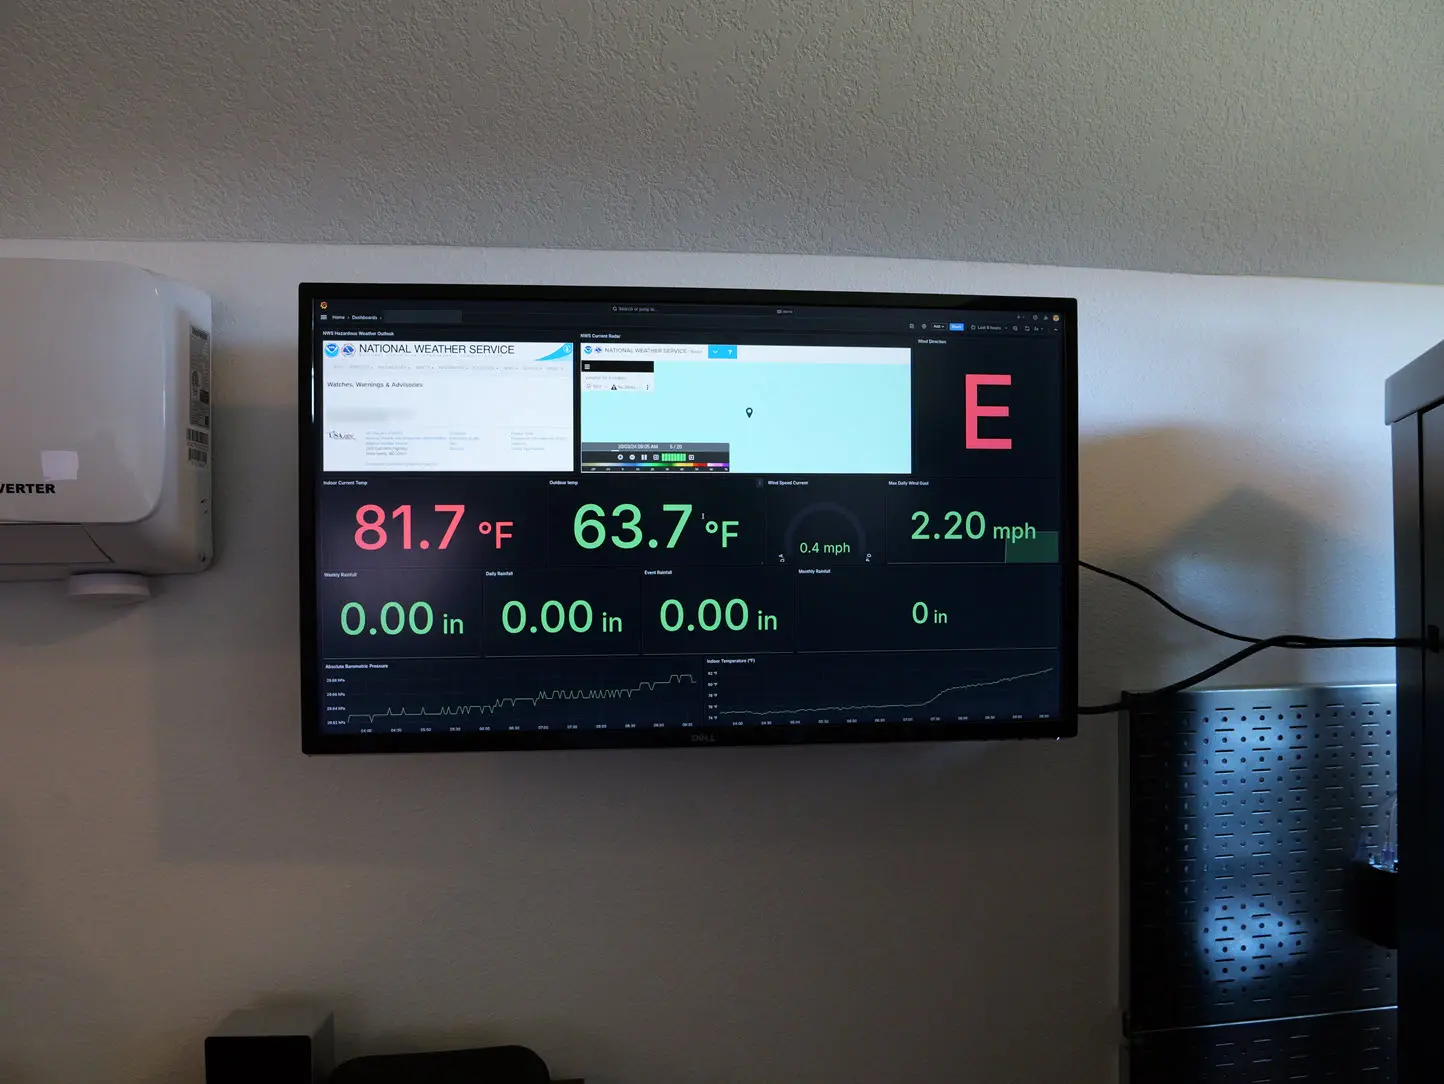
Below is a datastore summary dashboard showing available space and space used.
So far, I am really happy with the way this project turned out and it is working quite well. I have the dashboards on a 15 second delay between tabbing between the Chrome browser tabs.
Securing your Kiosk if needed
Below are just a few things you can do to secure your kiosk if this is more for a production environment or you have your kiosk in an area where you want to have it locked down more. Below are just a few ideas you can use to help secure the environment:
- Disable all unused ports
- Turn off Bluetooth
- Set up SSH using keys instead of using a password to secure access to the Raspberry Pi
Troubleshooting
What are some common things you might run into?
- Your Raspberry Pi doesn’t auto-login – Make sure you have run through the raspi-config steps shown above
- Your Grafana dashboards are prompting for a login – you will need to save the password in your Chrome browser on the Raspberry Pi
- The Raspberry Pi doesn’t automatically launch Chrome – Make sure you have the wayfire.ini file configured and the switchtab.sh script created and populated with the URLs you want to have it launch automatically when it runs the autologin
Inspiration for this project
I have been wanting to do something like this for a long while. Check out Jeff Gluon’s video on this topic. Also, an awesome home lab enthusiast with an incredible home lab data center:
Wrapping up
This is one of the coolest projects that I have worked on in a while and it is a great way I think to add a nice resource to your home lab to add a kiosk dashboard to read out various metrics and readings from your home lab environment. These dashboards are driven from Grafana which can be really any dashboard that you have running in your grafana environment in the home lab.
Google is updating how articles are shown. Don’t miss our leading home lab and tech content, written by humans, by setting Virtualization Howto as a preferred source.
About The Author