Netdata Docker Monitoring for Home Lab
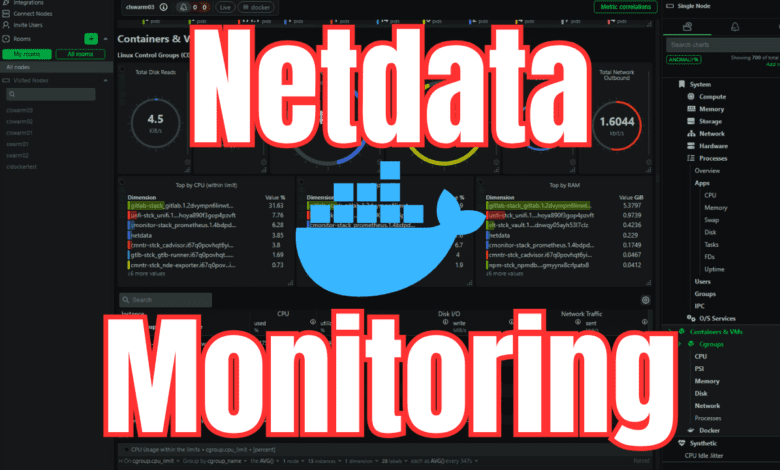
I have been playing around with a lot of Docker monitoring solutions to monitor my critical Docker containers. There are many great open source solutions you can use for Docker monitoring, including cAdvisor and Node Exporter which I have written about recently. However, there is also a cloud-based tool that I have found to be extremely easy to install and configure, called Netdata. Let’s take a look at Netdata Docker monitoring configuration and see how you can easily setup monitoring of your containerized infrastructure.
Table of contents
What is Netdata?
First of all, what is Netdata? Well, it is a tool that provides real-time monitoring of your environment so you can visualize and troubleshooting performance in your environment and various applications. It provides really good visualizations and overview of information for containerized and multi-node environments like swarm clusters and Kubernetes.
You can see metrics at one-second intervals with Netdata and metrics in real-time that cover CPU, memory, disk, network, and application metrics. It supports container monitoring with detailed metrics for container performance, cgroups metrics and config, and overall system health.
It is also easy to install as we will see. You can easily deploy it with a wget command running a shell script in linux, or by easily pulling their latest Docker container.
It has the concept of rooms that house your nodes and you can divide these up as you see fit and need for various teams, etc.
Installing Netdata on your Docker Container host
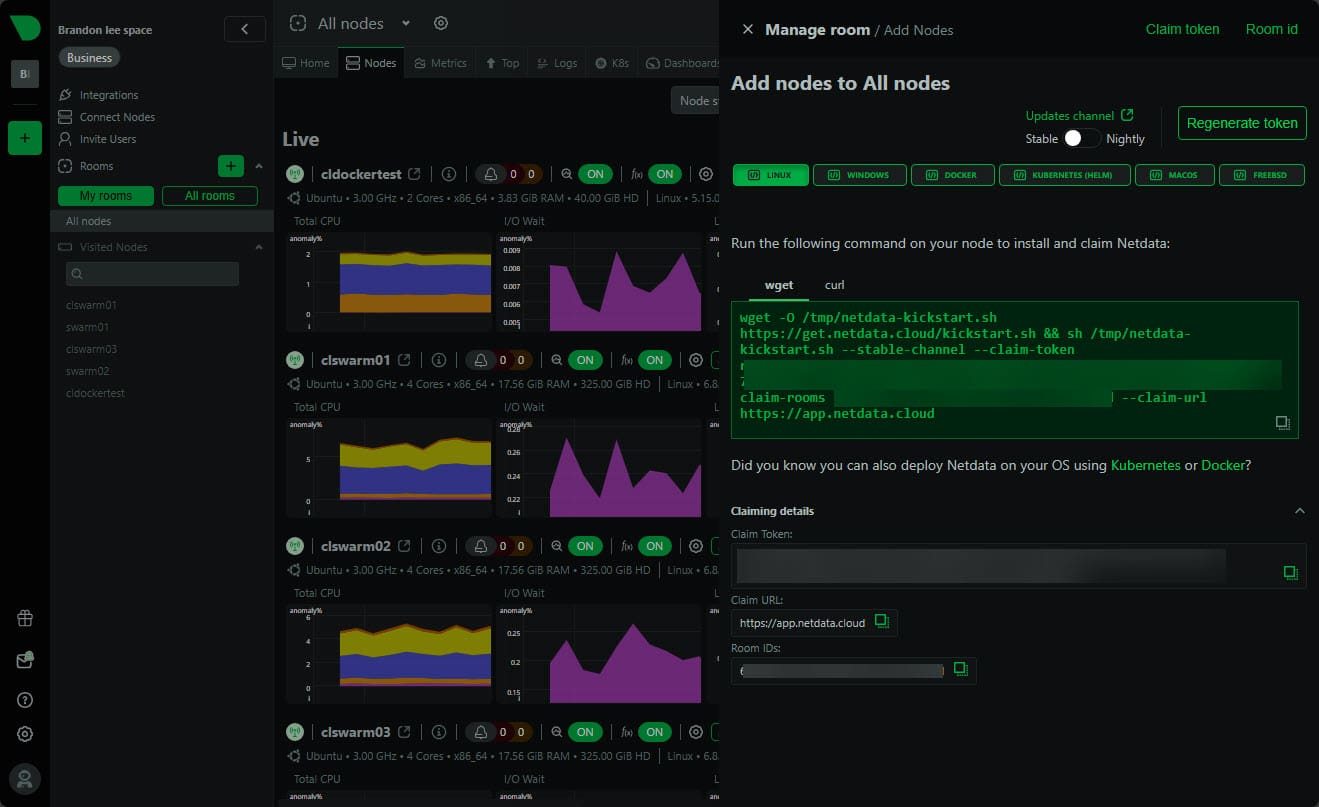
Installing Netdata is super easy. I really like how they have the installation and configuration process mapped out extremely well and it is easy to get up and running with monitoring. When you click the Add Nodes button, you will see the various options to add a node into monitoring with Netdata.
These include:
- Linux
- Windows
- Docker CLI
- Docker Compose
- Docker Swarm
- Kubernetes
- macOS
- FreeBSD
Below, you see the blade that pops out when you click the Add Node button. It will display the command you need to copy and run. So it makes this process simple. Also, it automatically embeds your claim token and room ID into the command for you. So, this is not something you have to hunt around to find, etc, which is nice.
Choices in monitoring
You might wonder what the difference is if you choose to monitor via Linux instead of Docker on your Docker container host running on a Linux OS, and I did too. In testing between them, both of them were able to scrape Docker metrics and have insights into Docker. However, one of the advantages I see with the Linux installation, especially for bare metal installs is that it adds metrics for hardware, like SMART errors, etc.
Whereas, if you use the Docker container installation on the same host, the hardware is likely abstracted from what it can see, so you don’t get those metrics. However, the flip side is that the Docker installation is much easier to manage than the Linux installation, since you would need to manually update your installation on Linux and with docker, you can take advantage of the easy nature to re-pull the image for your Netdata container. So, there are definitely pros and cons to each method for monitoring.
Netdata Docker Monitoring
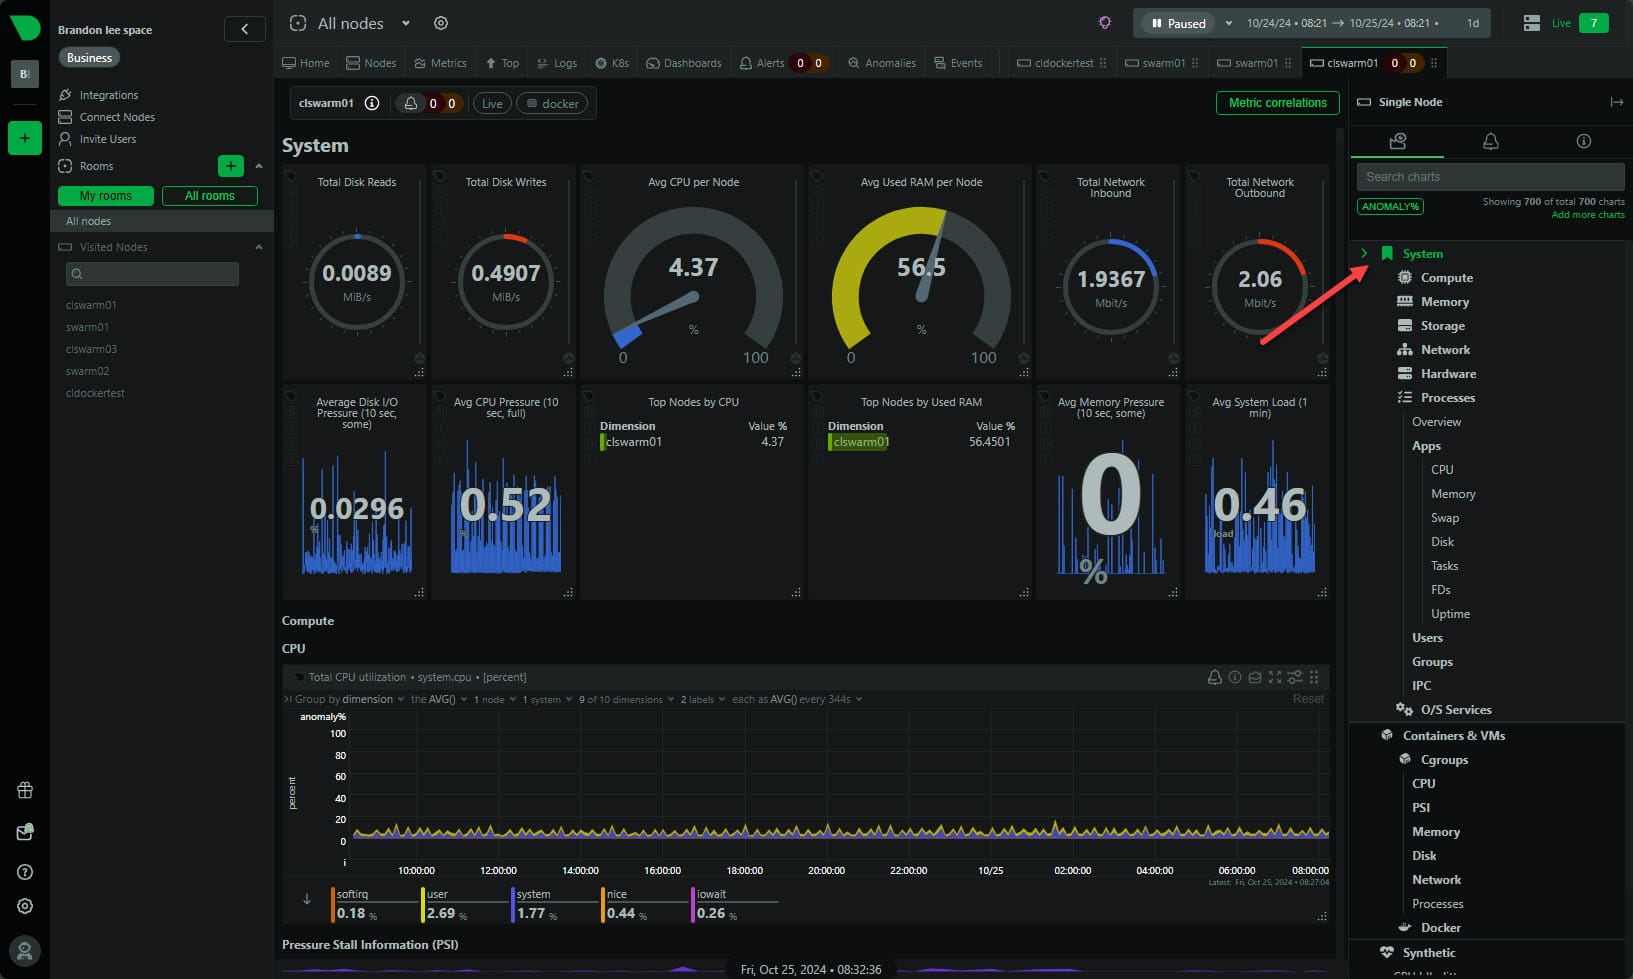
Below, you see a system overview of a Docker container host, including compute, memory, storage, network, hardware, processes, etc.
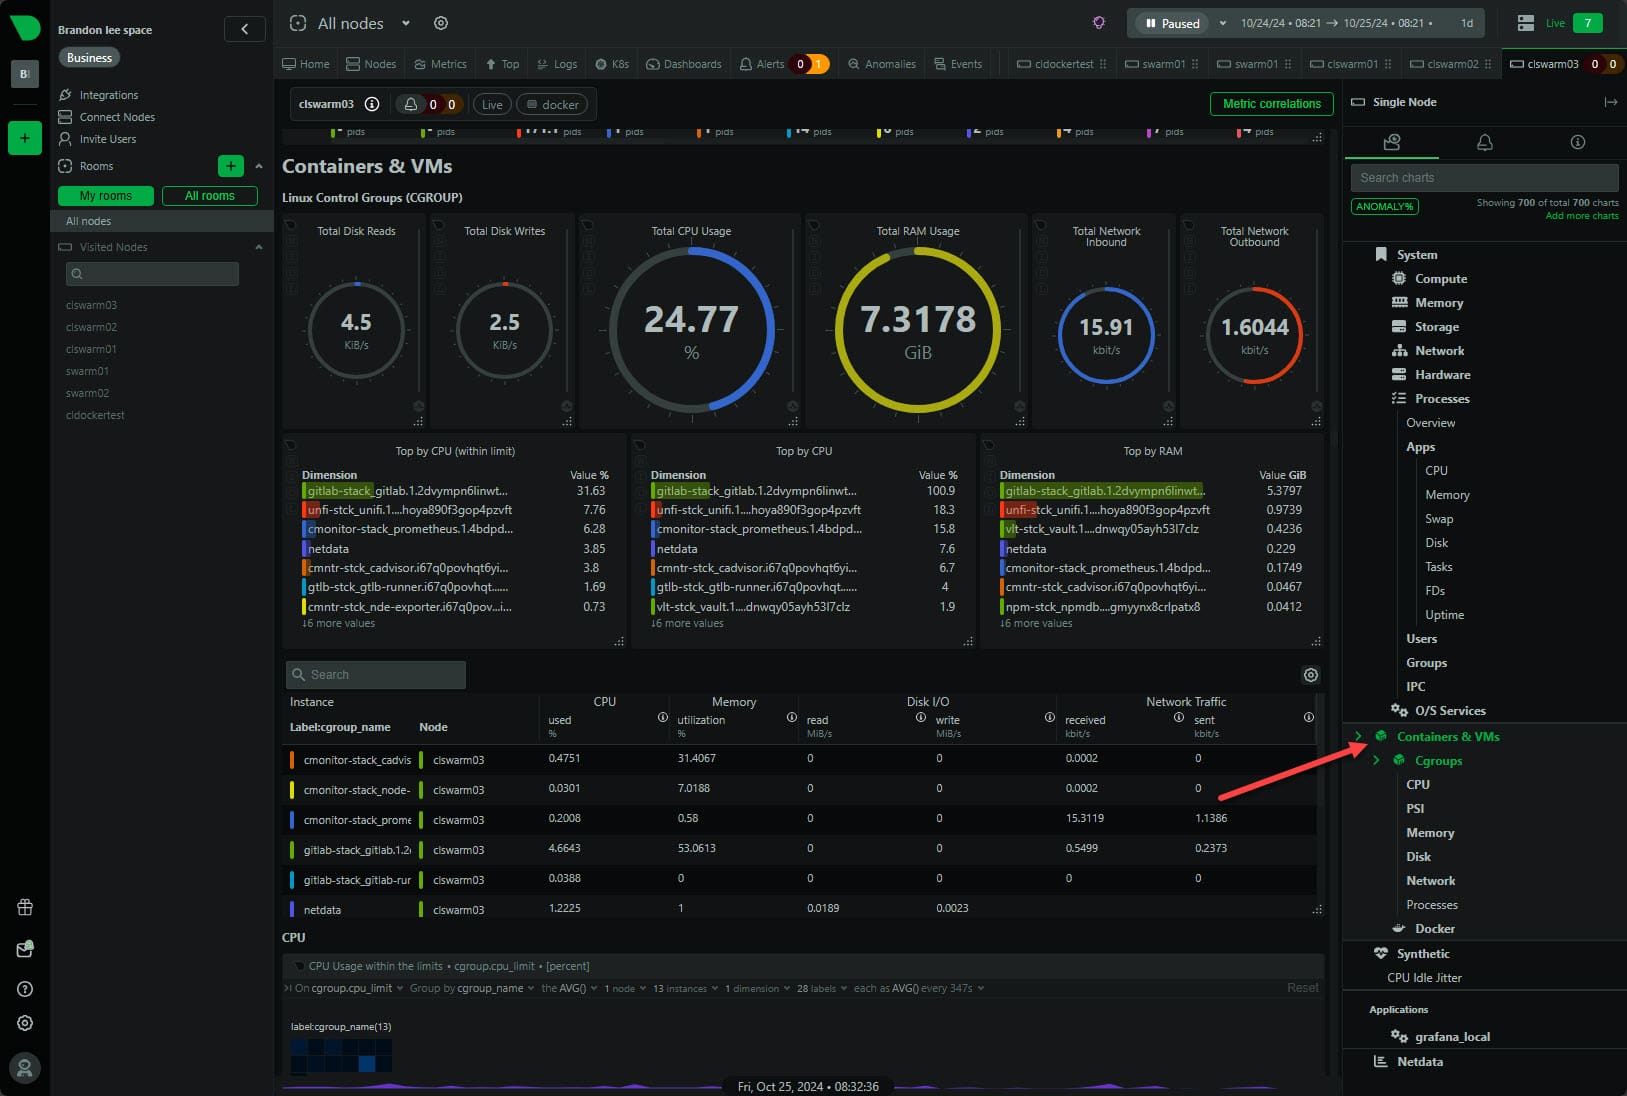
One of the really great views of information you get with Netdata is the Containers & VMs view. It allows you to quickly see problematic containers or those that are taking up a lot of resources on your container host.
Alerting
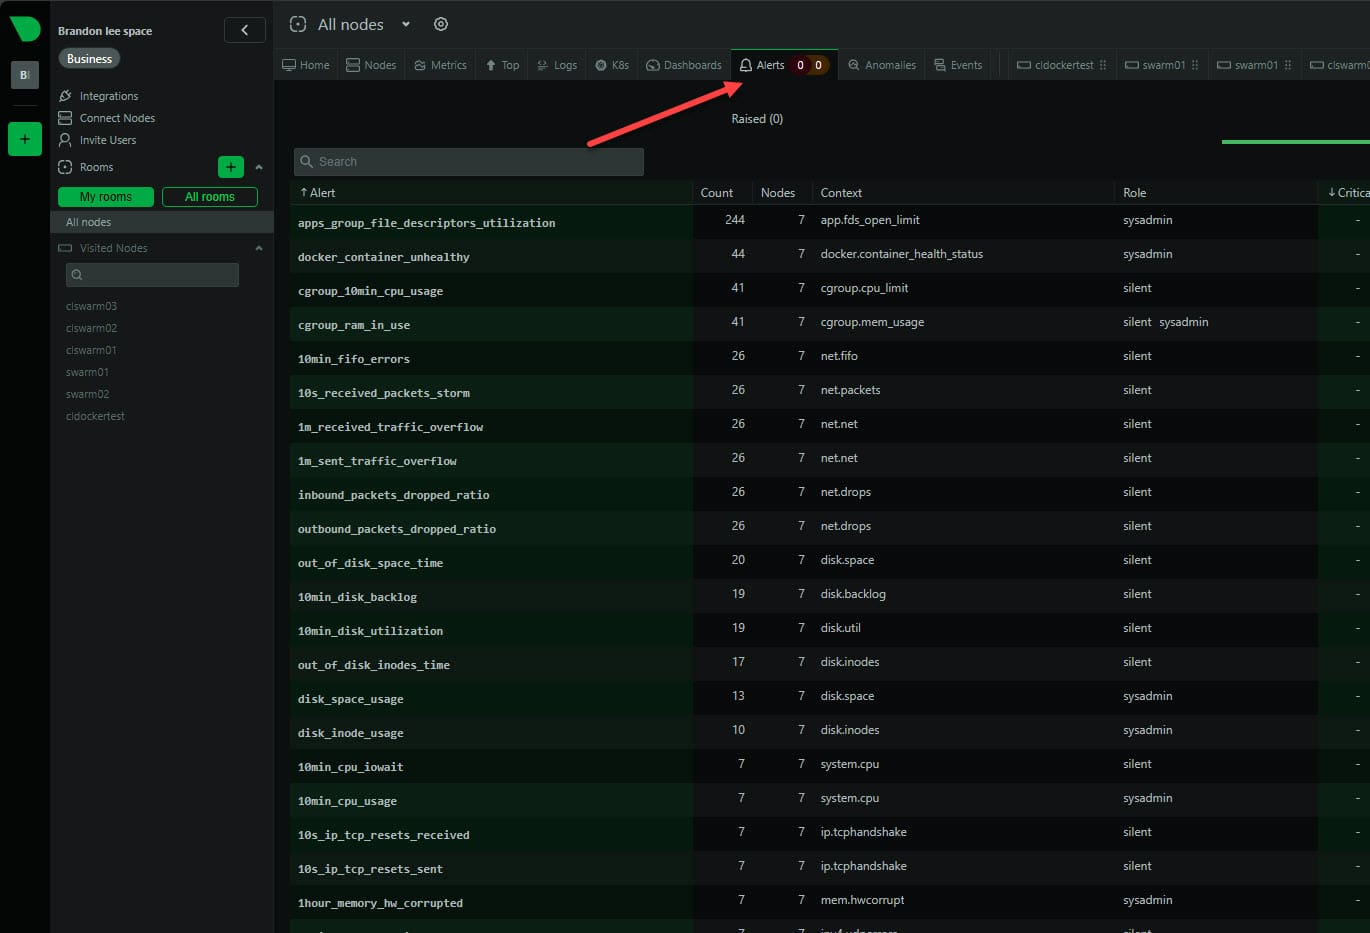
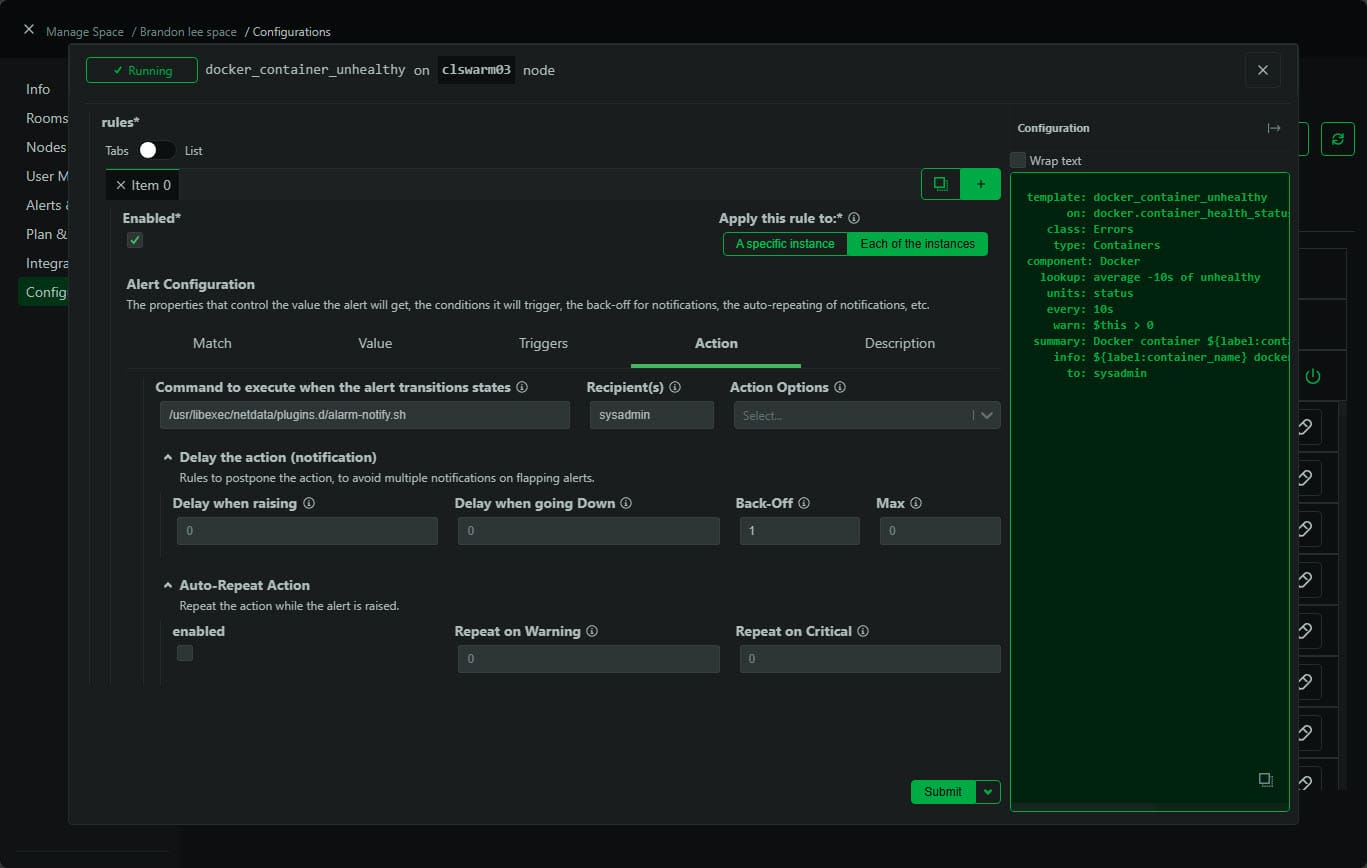
One of the great features of Netdata I think is the built-in alerts. While you can customize and create your own alerts, so far I have found that most of the in-the-box alerts are just what I need. You can view the alerts from the alerts tab in your All nodes view.
There are many built-in alerts that help you to know if a container has gone down or is in an unhealthy state. This is an extremely good alert for containerized environments to help with knowing if a container went down or is in unhealthy state from a container restart, upgrade, image re-pull, etc.
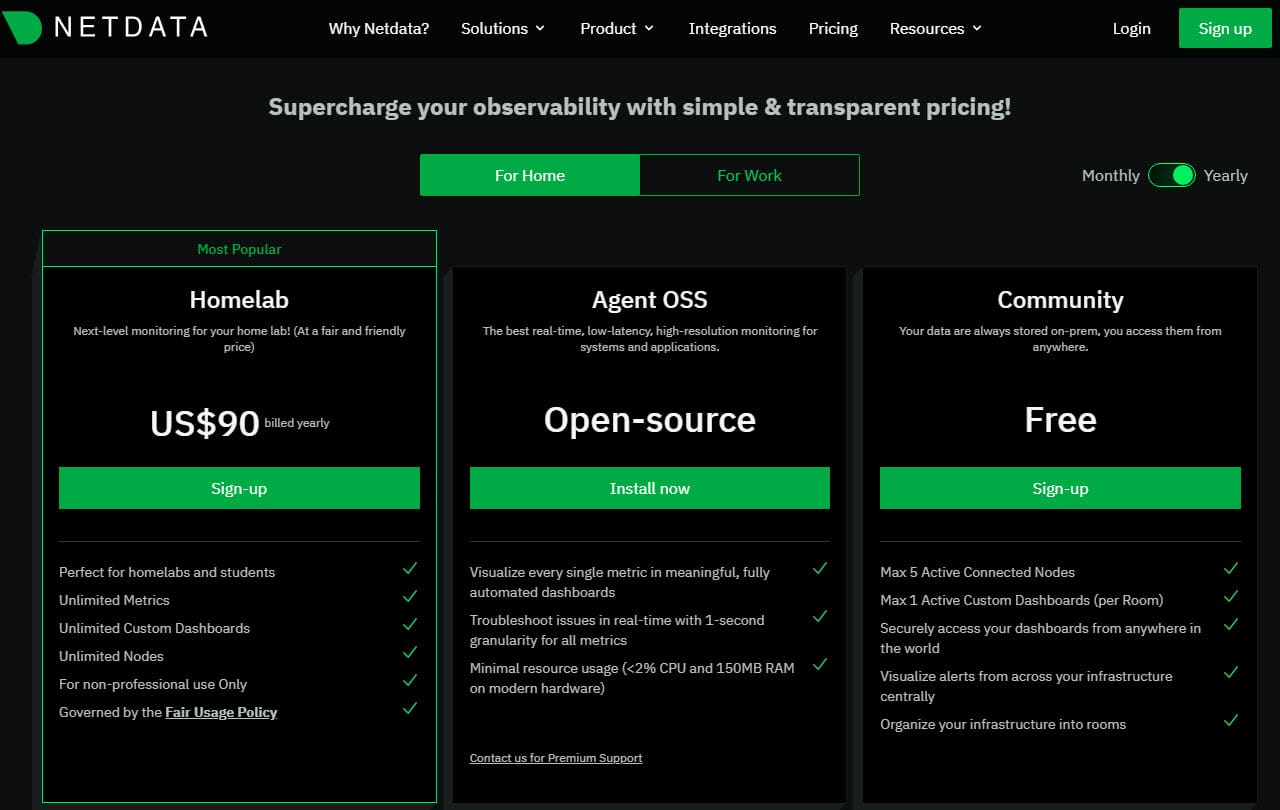
Home Lab version
Also, really cool to know is that Netdata is no offering a Home Lab plan that has literally EVERYTHING included as with the business edition. You get unlimited metrics, custom dashboards, nodes, but no support, which is perfect for home lab enthusiasts looking for a great solution at a reasonable price at only $90/year, which I think for a fully-featured monitoring solution in the cloud is an extremely good price.
Cloud monitoring vs on-premises monitoring
Many may say they would rather have on-premises monitoring at home or in the enterprise, and I get it. I like on-premises monitoring as well and still use a variety of tools in the toolset for monitoring in this way. However, I will say that something like Netdata is a great fit for many different use cases.
Since it is housed in the cloud, you don’t have to spin up all the infrastructure and server resources to house your monitoring solution. Also, you don’t have the catch 22 of your infrastructure going down and taking down your monitoring stack along with it, so that you don’t get any alerts that anything went down which i have seen in many environments.
If nothing else, i think adding Netdata to an existing monitoring solution plan is a great idea since you can augment your existing monitoring with cloud monitoring to cover things from both angles. If your production infrastructure housing your on-premises monitoring goes down, you still have the monitoring looking for the cloud agent that will alert you that something is down and not connecting.
Wrapping up
I think Netdata docker monitoring is a great solution that takes the hard work out of monitoring solutions and their configuration like Docker containers. Literally you can be up and running in a matter of minutes. Just sign up for a Netdata account and then spin up their Docker container and you will start seeing metrics streamed to your cloud dashboard.
While I love grafana, cadvisor, node exporter, etc, this is a much quicker way to get visibility into your docker container metrics on your docker host.

