Recently, I have been taking a hard look at a container monitoring solution for my home lab and production environment. This is honestly an area where a lot of off-the-shelf traditional monitoring solutions just don’t do a good job. However, there are some free and open source tools developed in the community that allow us to do some really great Docker monitoring and infrastructure monitoring of our Docker hosts running containers. Let’s take a look at Docker container monitoring with cAdvisor, Node Exporter, Prometheus, and Grafana.
Table of contents
Why monitor Docker containers?
Well, like other infrastructure monitoring can help to give visibility to issues, problems, or other metrics that need to be addressed as part of your application performance monitoring. Docker monitoring tools allow you to monitor docker and key metrics that shed light on anomaly detection, performance issues, stability issues, or just overall sanity checks of your containerized applications to make sure everything is running as expected.
Performance Monitoring
One aspect is performance monitoring. This might include:
- Monitor container performance metrics, such as CPU usage, memory usage, and network I/O
- Using the info to identify bottlenecks and improve container performance
- Use tools like Prometheus and Grafana to collect and visualize performance metrics.
Security Monitoring
Another aspect is security monitoring. This might include:
- Monitor container security metrics, such as network traffic and system processes
- Help identify potential security threats and vulnerabilities
Docker monitoring tools
As it turns out, the best docker monitoring tools are free and open-source solutions for monitoring docker containers. Note the following solutions we will look at that are all found on the cloud native computing foundation list of open-source monitoring tool solutions that can help gather and make use of container metrics:
- cAdvisor: cAdvisor (Container Advisor) is a tool that provides real-time monitoring and a view of resource usage and performance metrics for containers. It helps you to see CPU, memory, network, and disk statistics related to your containers.
- Node Exporter: Node Exporter is an agent for exposing system-level metrics about the Docker container host. It gives you metrics such as CPU, memory, disk, and network usage for your host. It can export these statistics to Prometheus for monitoring physical and virtualized servers.
- Prometheus: Prometheus is a monitoring and alerting tool that collects metrics from systems and services and then it stores them in a time-series database. You can then set up alerts based on those metrics. Data can be scraped from exporters like Node Exporter and cAdvisor and sent to Grafana or some other log management solution
- Grafana: Grafana is a visualization tool that easily allows you to have visually appealing dashboards and it integrates with data sources like Prometheus. The dashboards can provide a view of real-time data for monitoring metrics. You can customize the look of graphs and visualizations for analyzing performance metrics and tracking performance issues
The above tools make container monitoring work easy and gives you very similar results to a paid solution such as sematext infrastructure monitoring and system tools.
Installing Docker container monitoring
Actually, installing Docker container monitoring is easy with Docker Compose. You can create the monitoring “stack” in Docker Compose and then deploy this to your container hosts individually or install it as a service in Docker Swarm.
Note the following Docker Compose code that will stand up your container monitoring system:
version: "3.8"

services:
  grafana:
    user: "1001"
    image: grafana/grafana
    container_name: grafana
    restart: always
    ports:
      - 3000:3000
    environment:
      - GF_PANELS_DISABLE_SANITIZE_HTML=true
      - GF_SECURITY_ADMIN_USER=${GRAFANA_USER}
      - GF_SECURITY_ADMIN_PASSWORD=${GRAFANA_PASSWORD}
      - GF_USERS_ALLOW_SIGN_UP=false
    networks:
      - monitoring
    volumes:
      - "/home/linuxadmin/homelabservices/grafana/grafana-volume:/var/lib/grafana"

  prometheus:
    image: prom/prometheus:latest
    container_name: prometheus
    restart: always
    user: "1001"
    ports:
      - 9090:9090
    environment:
      - PUID=1001
      - PGID=1001
    command:
      - '--config.file=/etc/prometheus/prometheus.yml'
      - '--log.level=error'
      - '--storage.tsdb.path=/prometheus'
      - '--storage.tsdb.retention.time=7d'
    volumes:
      - type: bind
        source: "/home/linuxadmin/homelabservices/prometheus"
        target: /prometheus
      - type: bind
        source: "/home/linuxadmin/homelabservices/prometheus/prometheus.yml"
        target: /etc/prometheus/prometheus.yml
    networks:
      - monitoring

  cadvisor:
    image: gcr.io/cadvisor/cadvisor:v0.47.0
    container_name: cadvisor
    restart: always
    command: -logtostderr -docker_only
    volumes:
      - type: bind
        source: /
        target: /rootfs
        read_only: true
      - type: bind
        source: /var/run
        target: /var/run
        read_only: true
      - type: bind
        source: /sys
        target: /sys
        read_only: true
      - type: bind
        source: /var/lib/docker
        target: /var/lib/docker
        read_only: true
      - type: bind
        source: /dev/disk
        target: /dev/disk
        read_only: true
    networks:
      - monitoring

  node-exporter:
    image: prom/node-exporter:v1.5.0
    container_name: nodeexporter
    restart: always
    command:
      - '--path.sysfs=/host/sys'
      - '--path.procfs=/host/proc'
      - '--collector.filesystem.ignored-mount-points=^/(sys|proc|dev|host|etc)($$|/)'
      - '--no-collector.ipvs'
    volumes:
      - type: bind
        source: /
        target: /rootfs
        read_only: true
      - type: bind
        source: /proc
        target: /host/proc
        read_only: true
      - type: bind
        source: /sys
        target: /host/sys
        read_only: true
    networks:
      - monitoring

volumes:
  prometheus-data:
    driver_opts:
      type: none
      o: bind
      device: "/home/linuxadmin/homelabservices/prometheus"

networks:
  monitoring:
    driver: bridge
You will need to create the prometheus.yml file for configuring Prometheus. Below is an example of what this file would look like using my host addresses:
global:
  scrape_interval: 15s  # How frequently to scrape targets
  evaluation_interval: 15s  # How frequently to evaluate rules

scrape_configs:
  - job_name: 'docker_swarm'
    static_configs:
      - targets:
        - 10.1.149.59:9100  # Node Exporter running on Swarm node 1
        - 10.1.149.60:9100  # Node Exporter running on Swarm node 2
        - 10.1.149.61:9100  # Node Exporter running on Swarm node 3

  - job_name: 'cadvisor'
    static_configs:
      - targets:
        - 10.1.149.59:8080  # cAdvisor running on Swarm node 1
        - 10.1.149.60:8080  # cAdvisor running on Swarm node 2
        - 10.1.149.61:8080  # cAdvisor running on Swarm node 3
Once you have your prometheus configuration file in place and directory structure for your persistent data configured, you can bring up the stack with:
docker compose up -dThis Docker Compose code configures a monitoring stack with Grafana, Prometheus, cAdvisor, and Node Exporter running in Docker Swarm. Each service is configured to run within a shared overlay network called monitoring.
- Grafana: It uses the official Grafana image and runs on port 3000. The configuration includes environment variables to manage admin credentials and disable HTML sanitization for panels. Data persistence is mounted to the /opt/grafana/grafana-volume directory (which is a glusterfs volume on my container hosts) on the host to /var/lib/grafana inside the container. The service manager nodes with a specific monitoring label. But this is optional configuration that you can remove.
- Prometheus: This service handles collecting metrics using the YAML file (prometheus.yml), which an example is shown above. It uses bind mounts for persistent data in /opt/prometheus on the host. The storage retention is set to 7 days, and it runs with a non-root user (1001) for better security. The service restarts on failure and runs with a single replica.
- cAdvisor: cAdvisor provides container-level resource monitoring and is deployed in global mode, which means one instance will run on every node. It is set up with strict memory limits (128MB) and binds system directories for monitoring the docker daemon, such as the /var/lib/docker and /sysdirectories. All volumes are mounted as read-only to minimize security risks.
- Node Exporter: This gets hardware and OS metrics, including CPU, memory, and disk usage, from the host. It runs in global mode like cAdvisor, to place a monitoring agent on each node. System directories like /proc and /sys are bind-mounted read-only to gather metrics.
The overlay network named monitoring is used for the stack in the Swarm setup (orchestration tools). However, you can change this to any network you have configured for your containers in your environment. Also, volume mounts are used for storage.
Adding the data source in Grafana
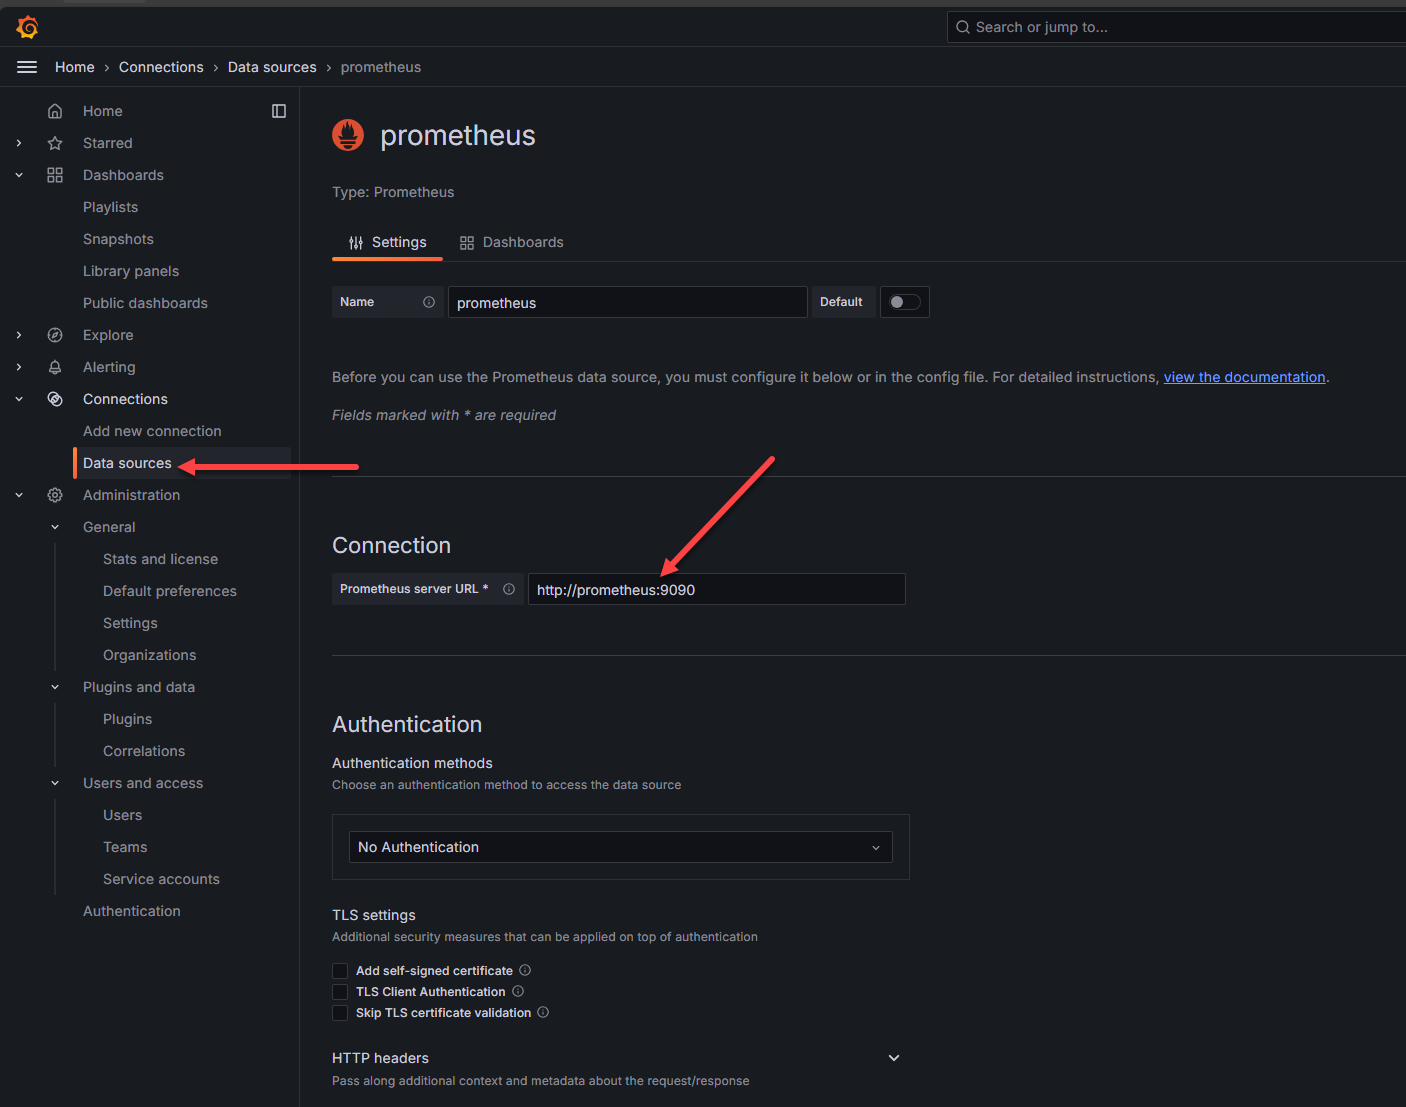
Now, we will still have a bit of configuration to do, but this is straightforward. First, we need to login to Grafana, and add the Prometheus data source.
Search for Prometheus in the data source catalog of services in Grafana and then in the configuration settings, point the Prometheus server URL to the URL of your internal container. This will be HTTP by default. You can use something like Nginx Proxy Manager to add SSL if you want.
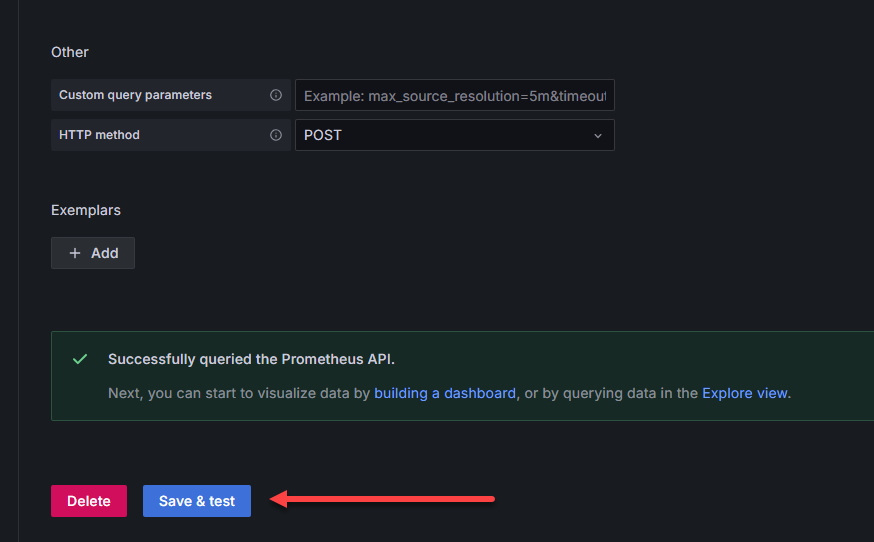
At the bottom of the configuration page, there is a Save & test button. Click this to test out the connection to Prometheus. You should get the green box that pops up and says “successfully queried the Prometheus API”.
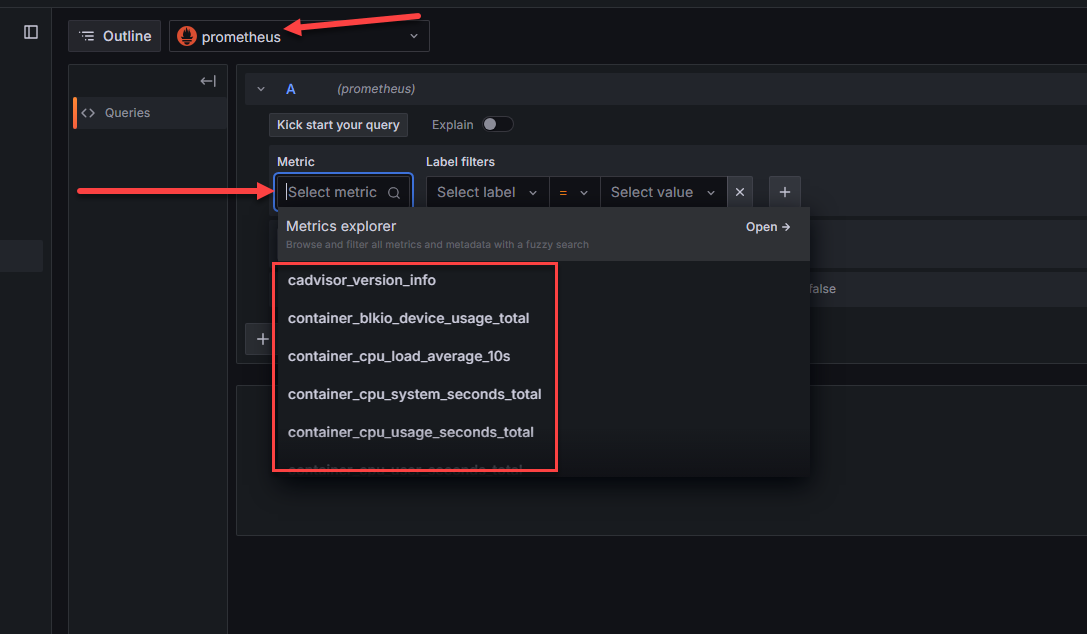
Once you do that, you should be able to Explore data at the top right:
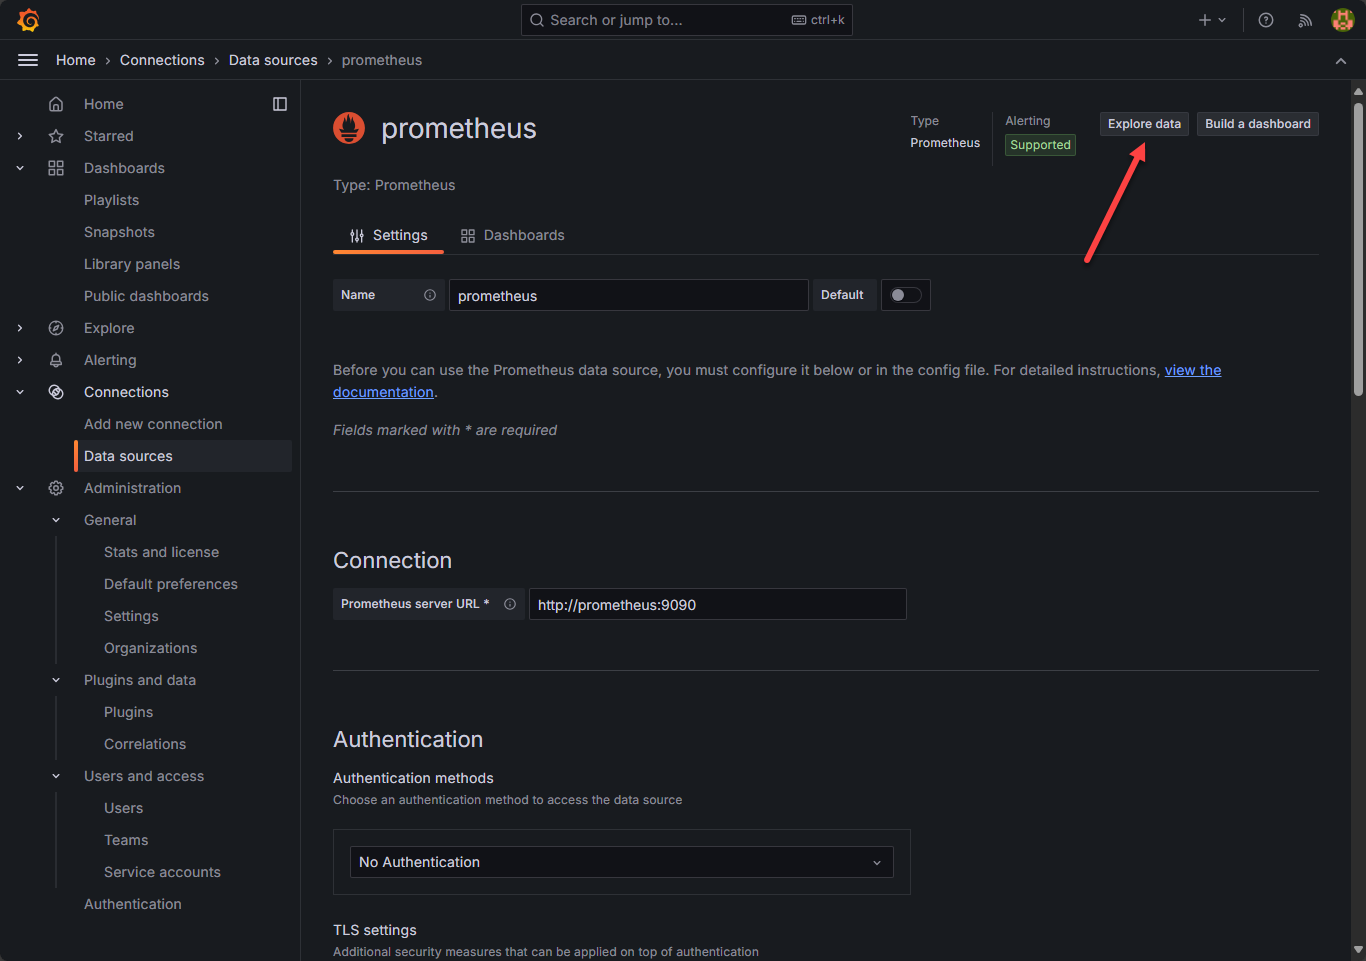
As you can see here, we are pointed to the Prometheus data source and when you click the drop down for metric, you should see the metrics collected by cadvisor, and node exporter, etc. If you do see the metrics collected, you know the data is successfully being queried by Prometheus.
Importing Grafana community dashboards
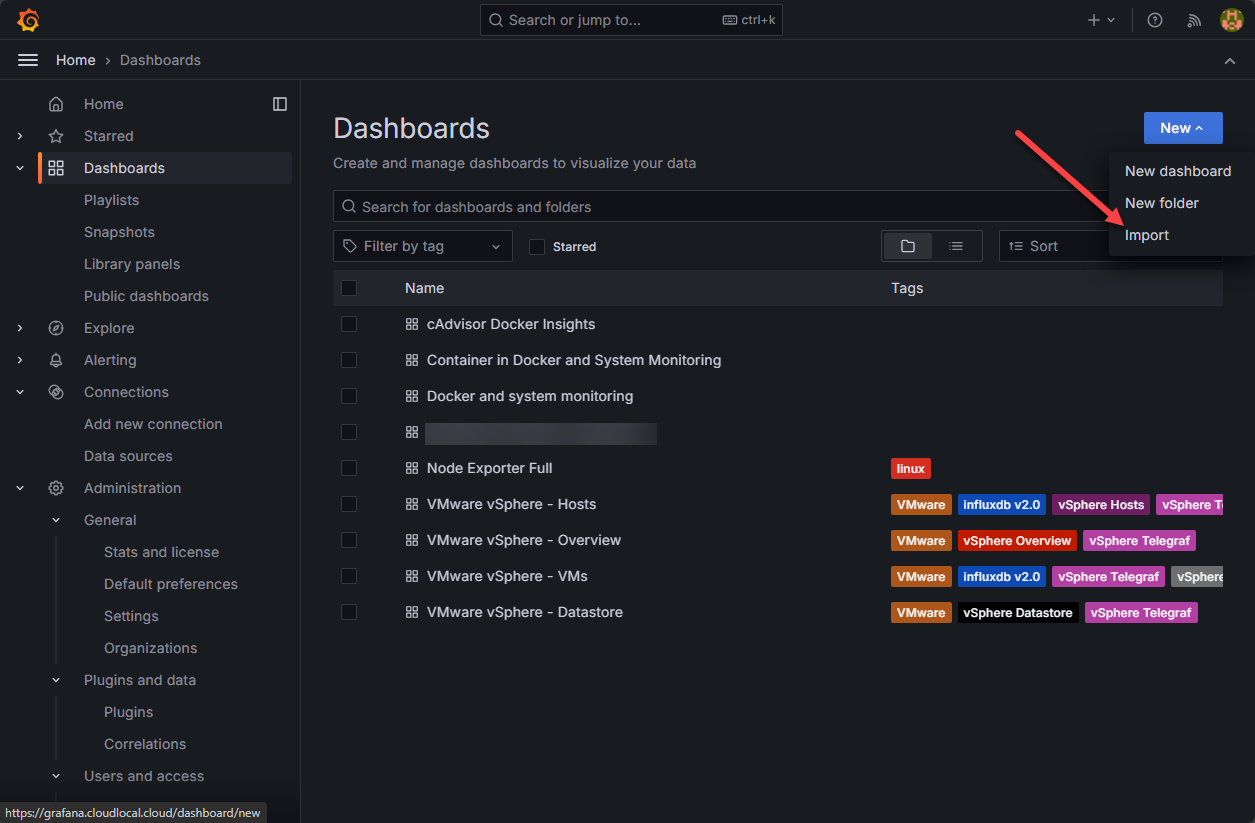
Now, we can start importing Grafana community dashboards to visualize this data. In Grafana, navigate to Dashboards > New > Import.
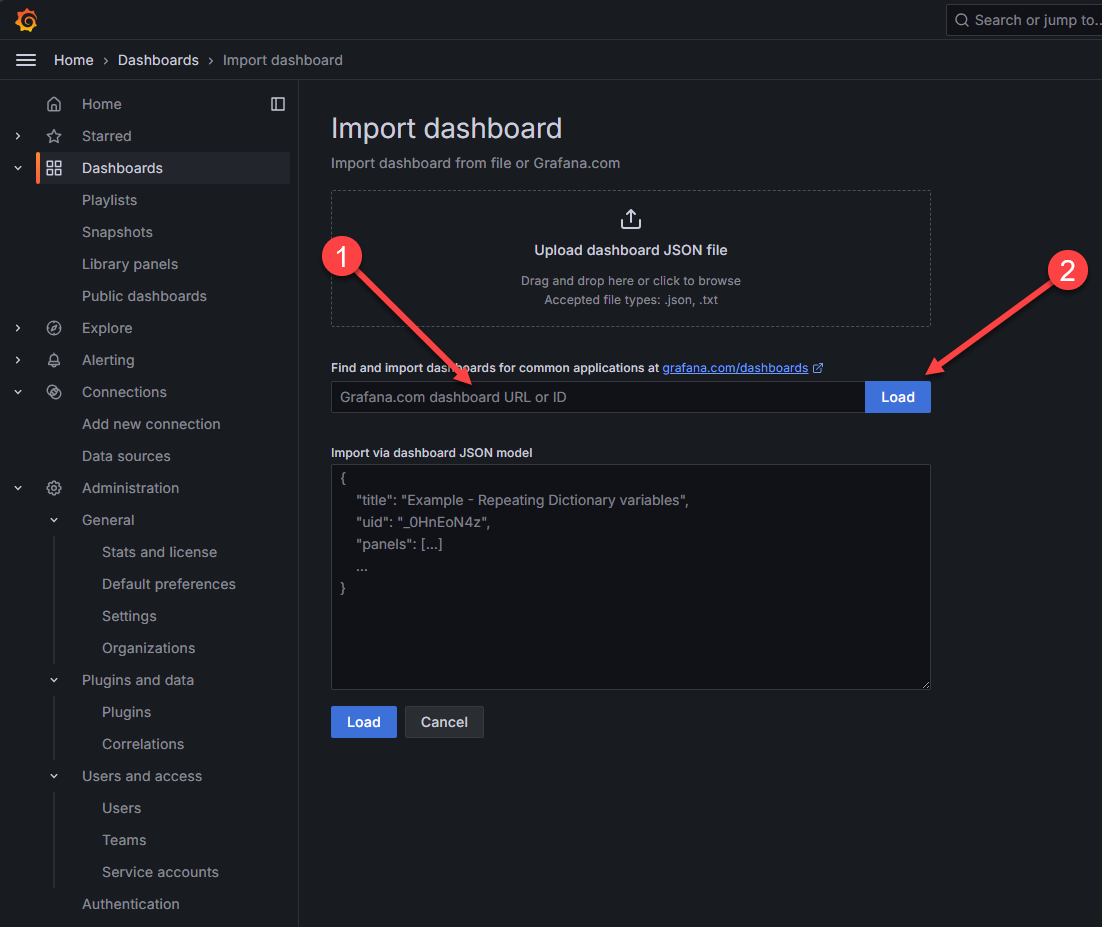
This will launch the Import Dashboard dialog. Here we can paste in a community dashboard ID and then click Load.
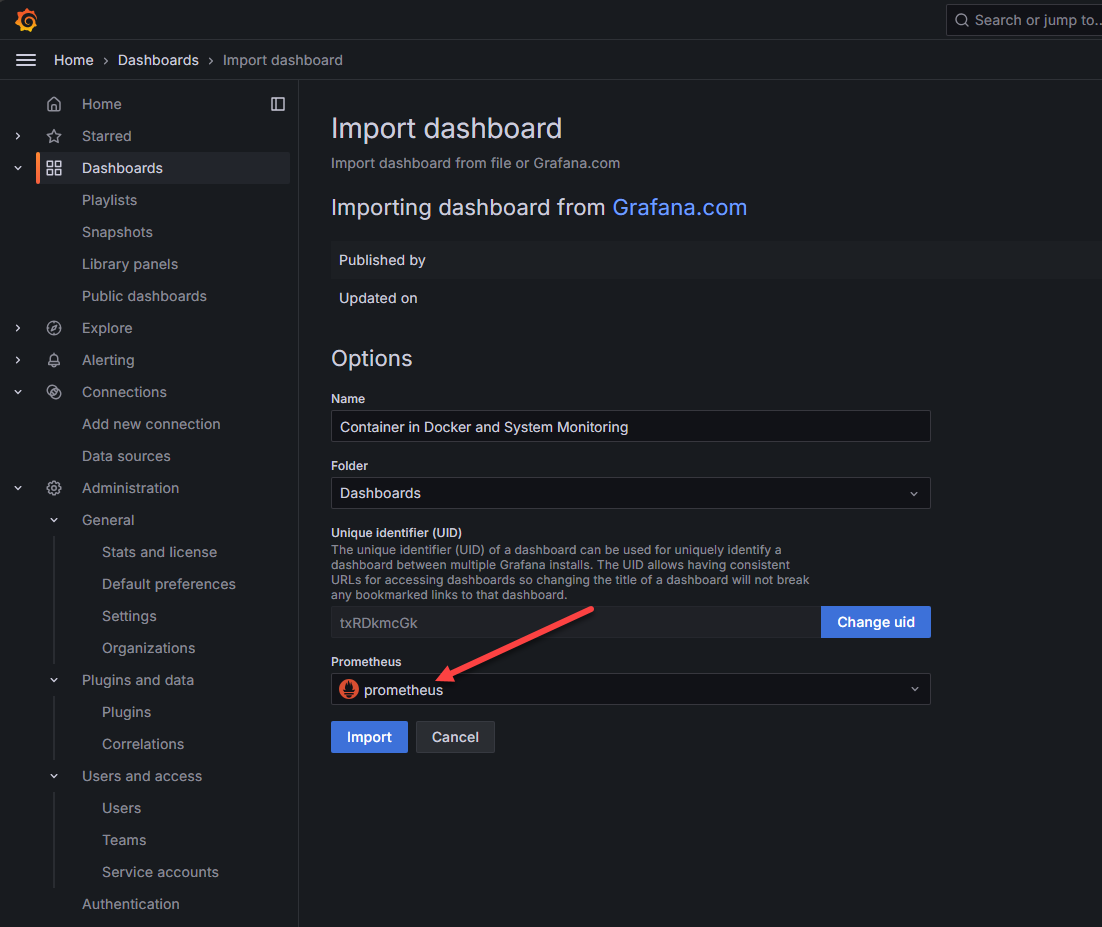
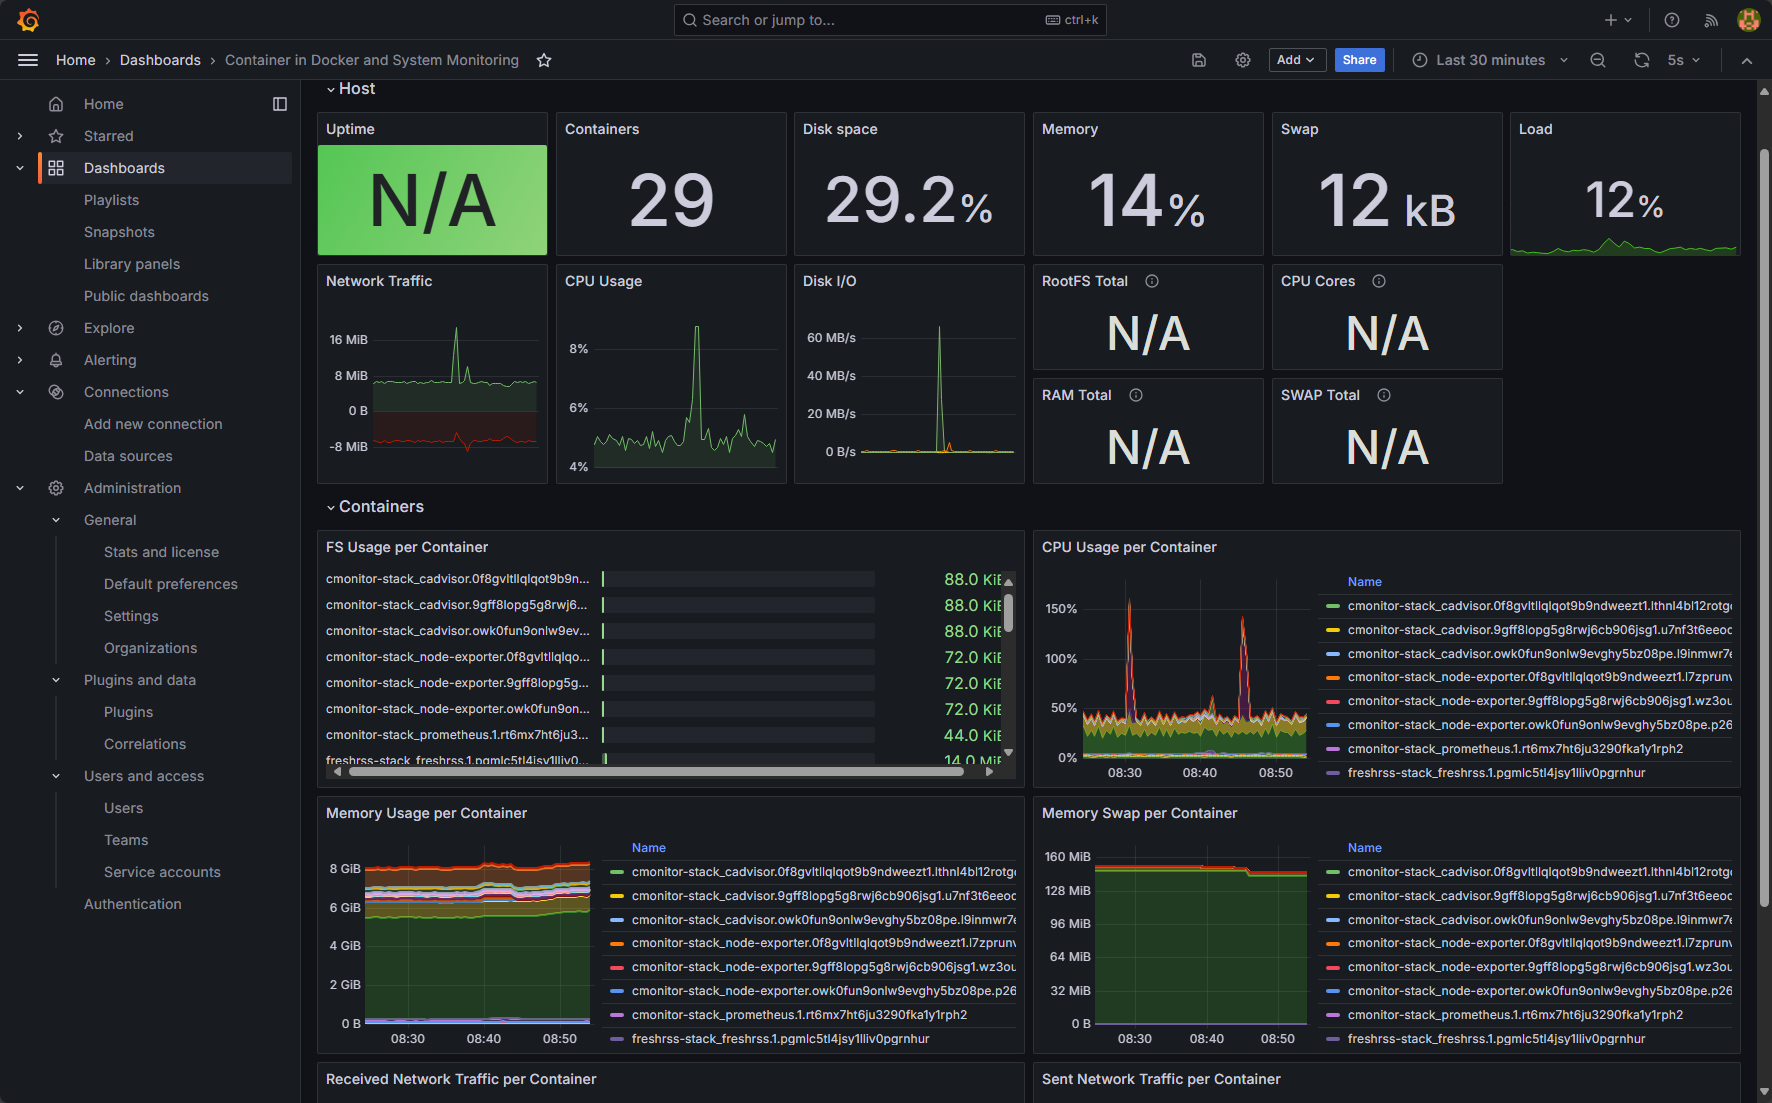
Here I pasted in the Container in Docker and System Monitoring dashboard that is freely available on the Grafana community dashboard site and is ID: 13112. Once you paste in the ID and hit Load, you will select Prometheus from the Prometheus drop down or whatever you named your Prometheus instance that you just setup.
Great information! It combines both Node Exporter information and cAdvisor to give an overall view of both your container host and the container metrics.
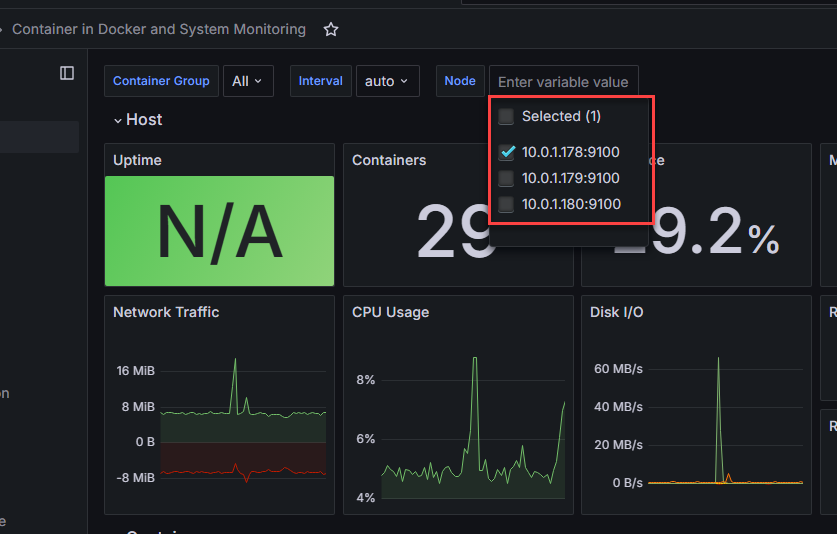
You can also select which host you want to drill into:
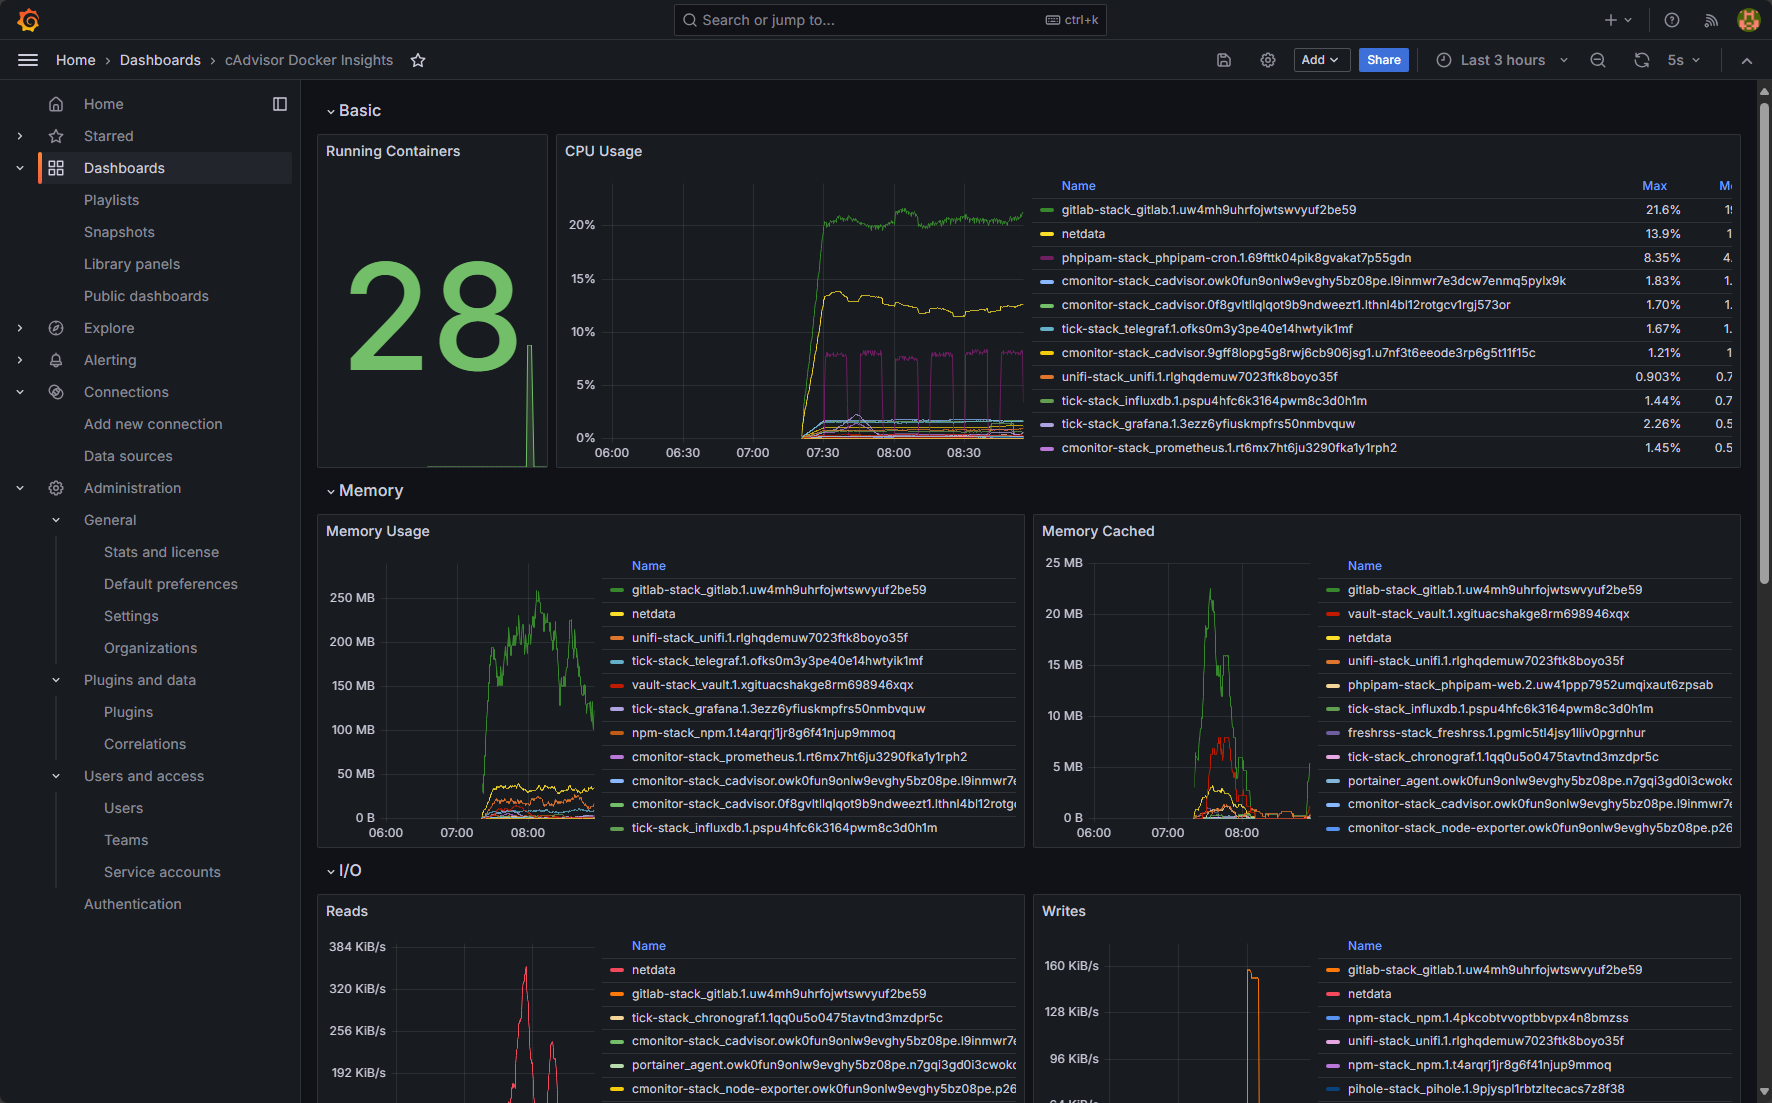
This one is cAdvisor and Docker insights:
Integrating with CI/CD Pipelines
Monitoring your Docker containers can also be integrated with CI/CD pipelines and systems. This allows you to automate monitoring and testing and also use the monitoring data in a meaningful way.
Run commands or scripts if monitoring data shows problems
One idea is that you can run commands or scripts automatically if monitoring data shows problems. This might be to scale your workloads, add new hosts, or do something else. The point is this can be used for automatic processes which are definitely beneficial for production environments.
Get started in the home lab
If you are not familiar with these open-source tools, a great way to get familiar with them is playing around with them in the home lab. Spin up a standalone Docker host and install the stack shown above. This will allow you to get your feet wet with a meaningful project that will take your container expertise to the next level.
Monitoring isn’t glorious, but it still can be fun using the right tools and understanding how everything works together.
Wrapping up
There are so many great free and open source container monitoring systems available to work with and keep an eye on KPIs of your Docker environment and infrastructure metrics resource utilization. However, the notables are Node Exporter, cAdvisor, Prometheus, and Grafana as these will provide a core base of tools that can help keep an eye on your environment. Hopefully the walkthrough above will help any get quickly up to speed on getting a general config up and running. As always, if you have any questions about container monitoring or anything else, check out the VHT forums and create a new forum topic: https://www.virtualizationhowto.com/community.
Google is updating how articles are shown. Don’t miss our leading home lab and tech content, written by humans, by setting Virtualization Howto as a preferred source.
About The Author