If you are using Ceph storage either in Proxmox or using Ceph storage in vanilla Linux outside of Proxmox, you likely want to have a way to see the health of your Ceph storage environment. Setting up a Ceph dashboard to see the health of your Ceph storage environment is a great way to have visibility on the health of your Ceph environment. Let’s look at how to setup a Ceph Dashboard for object storage health to see your storage health.
Table of contents
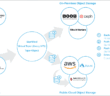
What is Ceph?
Ceph is software-defined object storage that makes use of local storage attached to hosts and logically shares this between the hosts and presents it as shared storage. This shared storage is replicated between the hosts or using erasure coding if you meet those requirements.
Setting up a Ceph dashboard
So, let’s look at the steps to setup a Ceph dashboard. In my configuration, I have three Ubuntu servers configured as a Swarm cluster and as Ceph nodes for the underlying storage with CephFS running on top. The steps to configure this as an overview, including the following steps:
- Enable the Prometheus module in Ceph
- Create a Prometheus configuration to scrape your Ceph servers
- Use Grafana to visualize the data scraped using Prometheus
1. Enable the Prometheus module in Ceph
Using the command line, there is an easy way to enable the Prometheus module in Ceph. How is this done? You can do that with the command:
ceph mgr module enable prometheusAs a note, you only have to do this on one of your hosts. It will then enable the module across the board.

After enabling, it is a good idea to make sure your Ceph hosts are listening on the exposed port of 9283. Below, you can see we can use the command:
netstat -tuln | grep 9283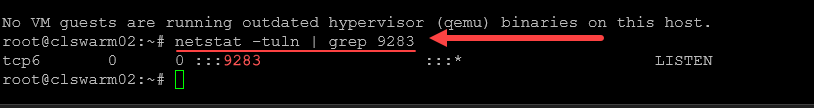
After verifying the hosts are listing on the exposed port, we are good to move on to the next step.
2. Create a Prometheus configuration to scrape your Ceph servers
Next, we need to create a Prometheus configuration for our Prometheus server (mine is external to my Ceph servers) to scrape the configuration of Ceph from the exposed port we have enabled.
In case you want to see a quick overview of how you would spin up a Prometheus server using Docker Compose, note the following:
services:
  prometheus:
    image: portainer/template-swarm-monitoring:prometheus-v2.44.0
    user: "1001"
    environment:
      - PUID=1001
      - PGID=1001
    command:
      - '--config.file=/etc/prometheus/prometheus.yml'
      - '--log.level=error'
      - '--storage.tsdb.path=/prometheus'
      - '--storage.tsdb.retention.time=7d'
    deploy:
      replicas: 1
      restart_policy:
        condition: on-failure
    volumes:
      - type: bind
        source: /mnt/cephfs/prometheus
        target: /prometheus
      - type: bind
        source: /mnt/cephfs/prometheus/prometheus.yml  # Correct path to the config file on the host
        target: /etc/prometheus/prometheus.yml         # Where Prometheus expects to find the config
    networks:
      - npm-stack_nginxproxy
Note the following Prometheus configuration.
You can add this to your existing configuration in Prometheus as an additional job:
# Job for Ceph Manager metrics
  - job_name: 'ceph_mgr'
    static_configs:
      - targets:
          - '10.1.149.21:9283'  # Ceph Mgr node 1
          - '10.1.149.22:9283'  # Ceph Mgr node 2
          - '10.1.149.23:9283'  # Ceph Mgr node 3
If you don’t have any existing configuration, you can use the following code:
# Ceph configuration
global:
external_labels:
monitor: 'Ceph'
# Scrape Job
scrape_configs:
- job_name: 'microceph'
# Ceph's default for scrape_interval is 15s.
scrape_interval: 15s
# List of all the ceph-mgr instances along with default (or configured) port.
static_configs:
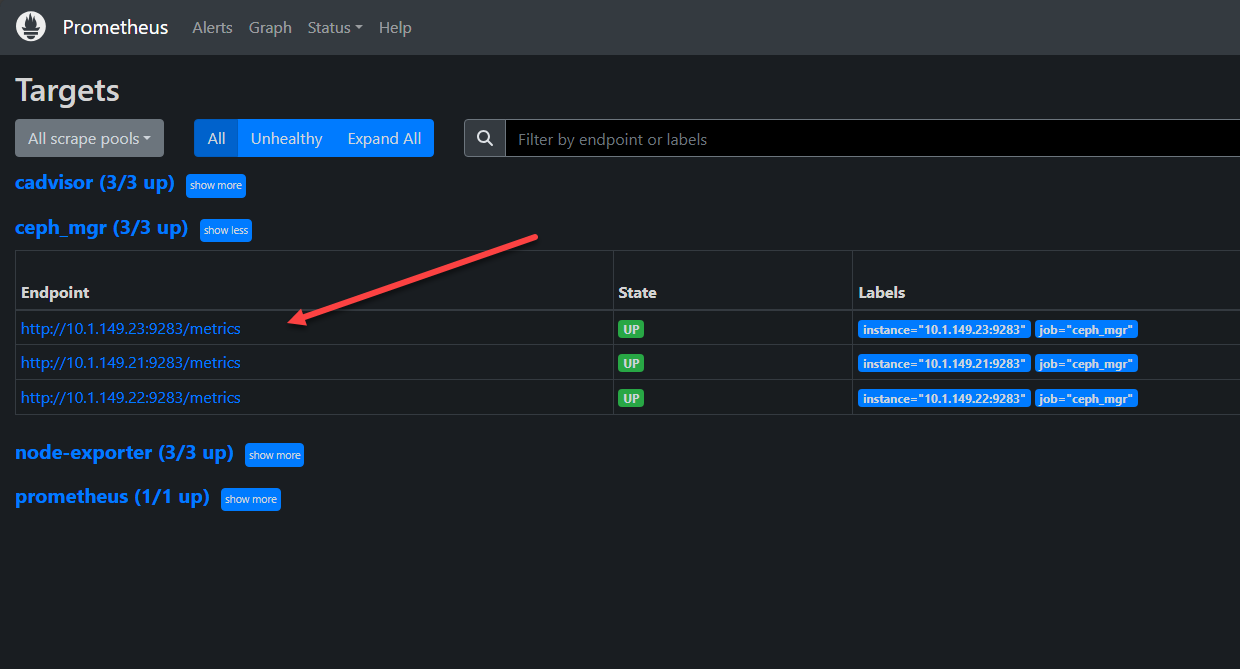
- targets: ['10.1.149.21:9283', '10.1.149.22:9283', '10.1.149.23:9283']Once you restart your Prometheus server config so that it reads your latest configuration file, you should be able to see that it has discovered your Ceph endpoints.
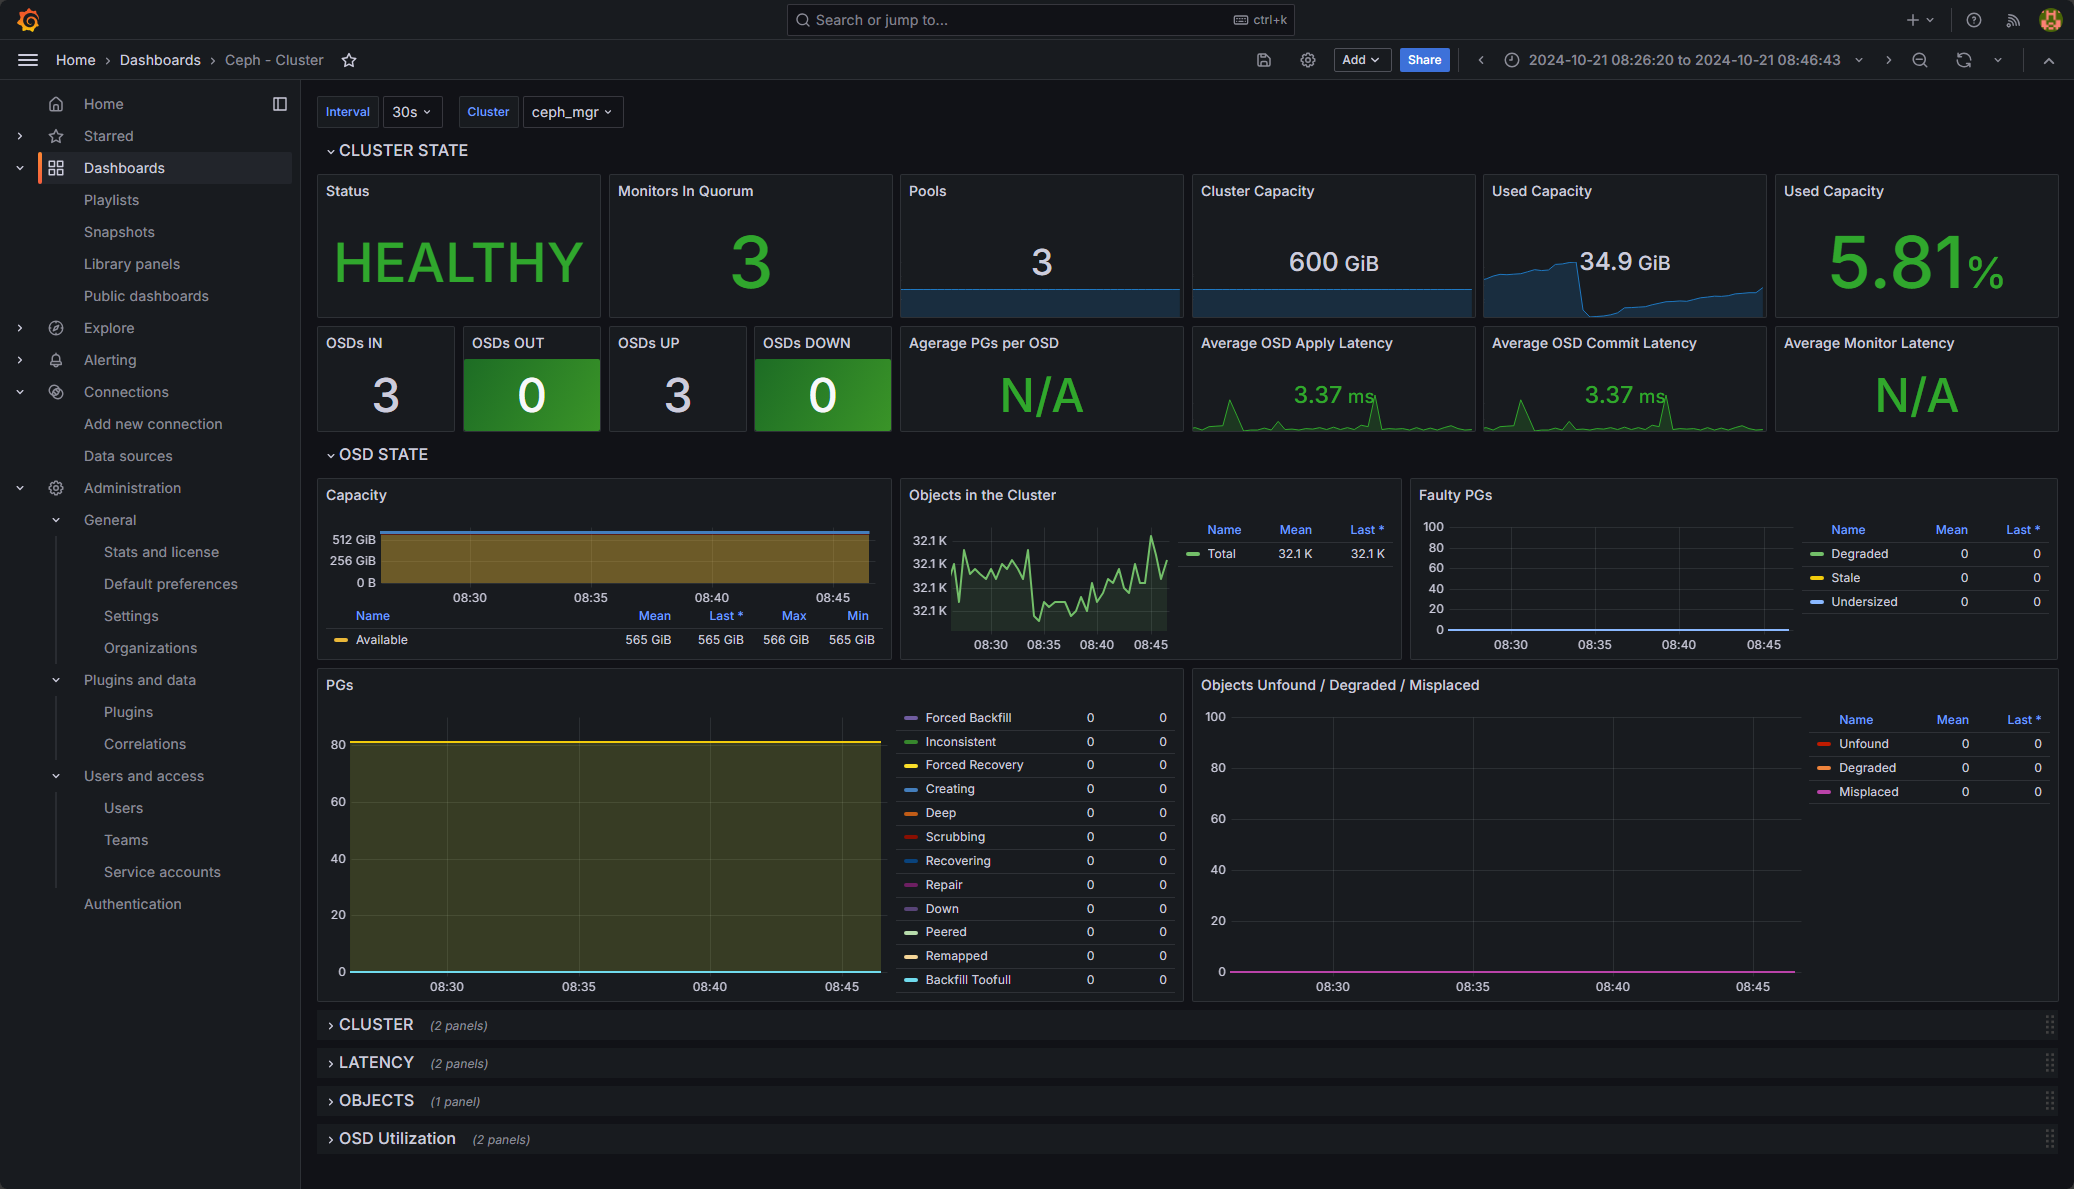
3. Use Grafana to visualize the data scraped using Prometheus
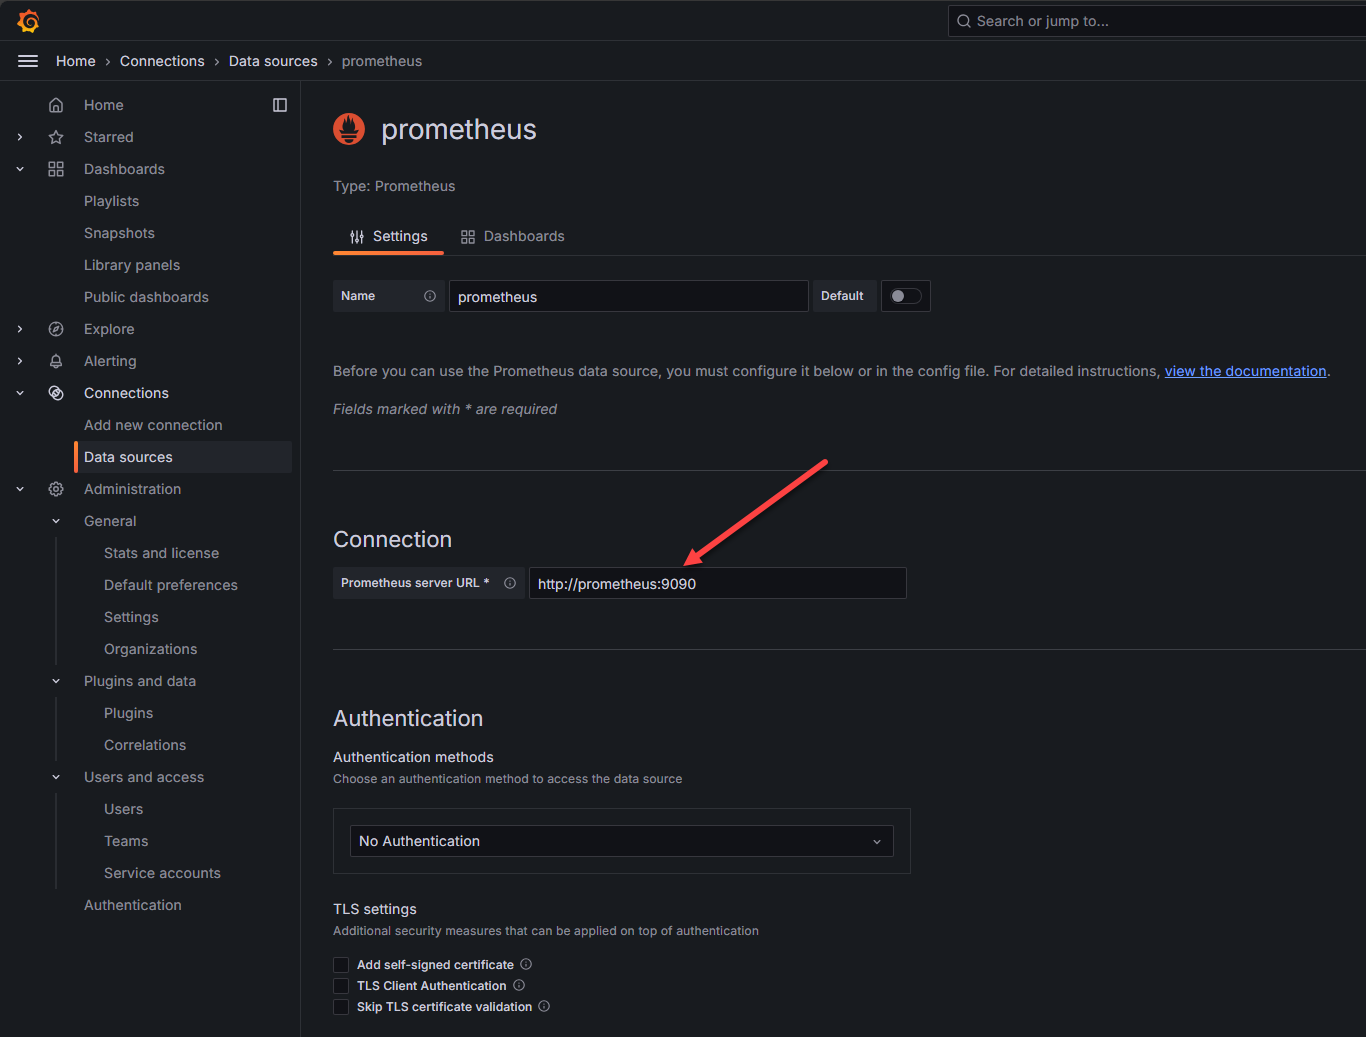
Now that we have Prometheus up and running and have the Prometheus configuration setup, we can now use Grafana to visualize the data collected in Prometheus. When you go to your Grafana configuration, you can add a data source and point your connection to your Prometheus server.
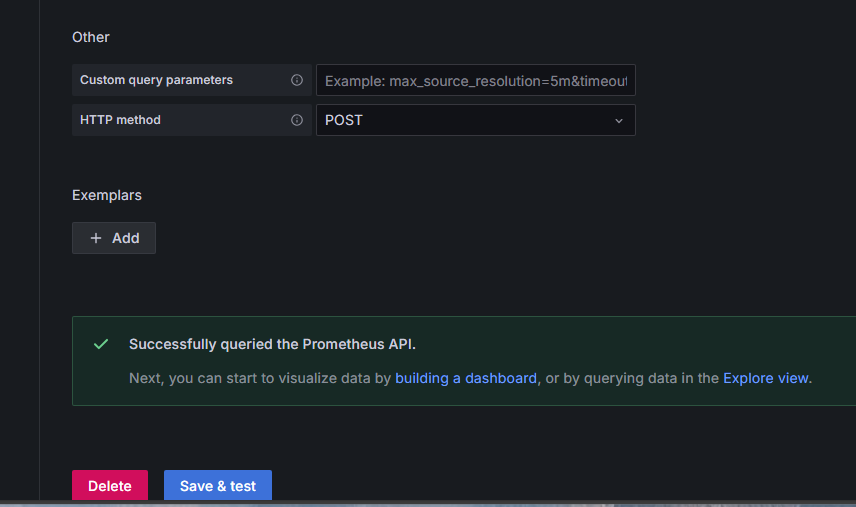
Save and test the configuration. You should see the successful message that it was able to query the API.
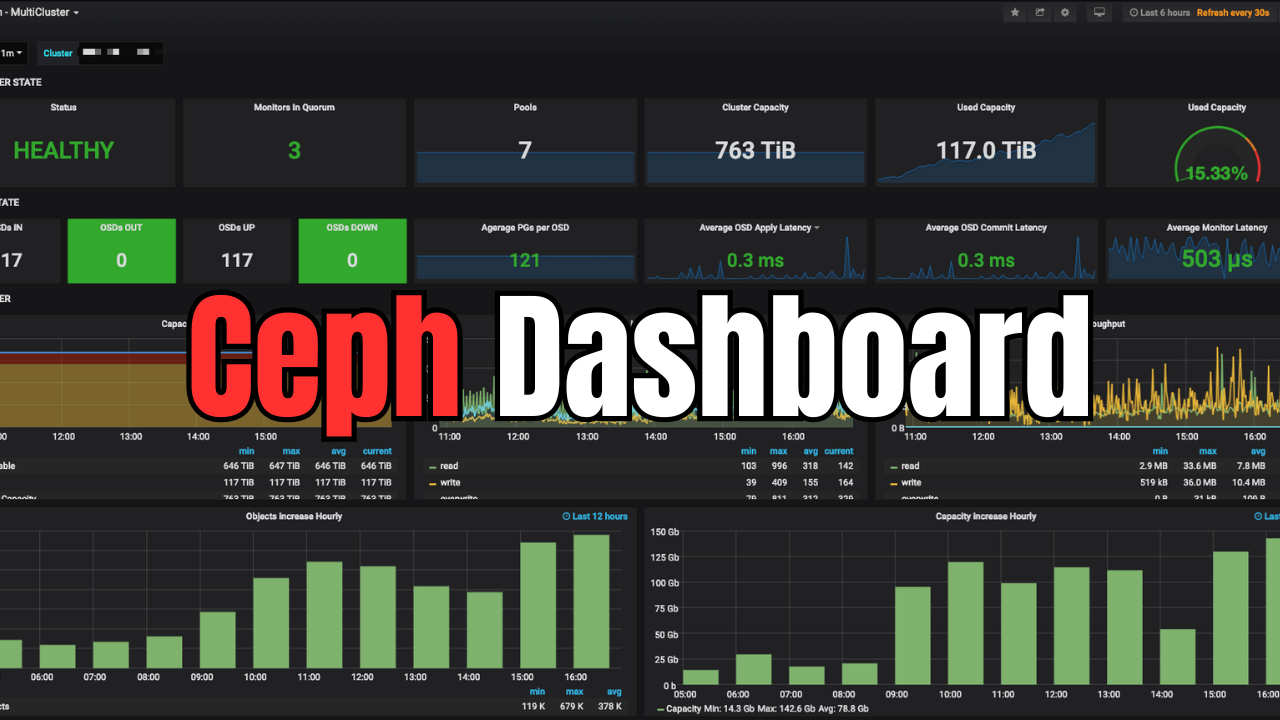
Grafana community dashboards
So, you may be thinking, how do I get all the visualizations that I want to visualize the Prometheus data? Well, the Grafana community dashboards will save you a lot of the time and effort. You can go to the community site here: https://grafana.com/grafana/dashboards and search for Ceph. This will bring up a wealth of already published dashboards for your Ceph data.
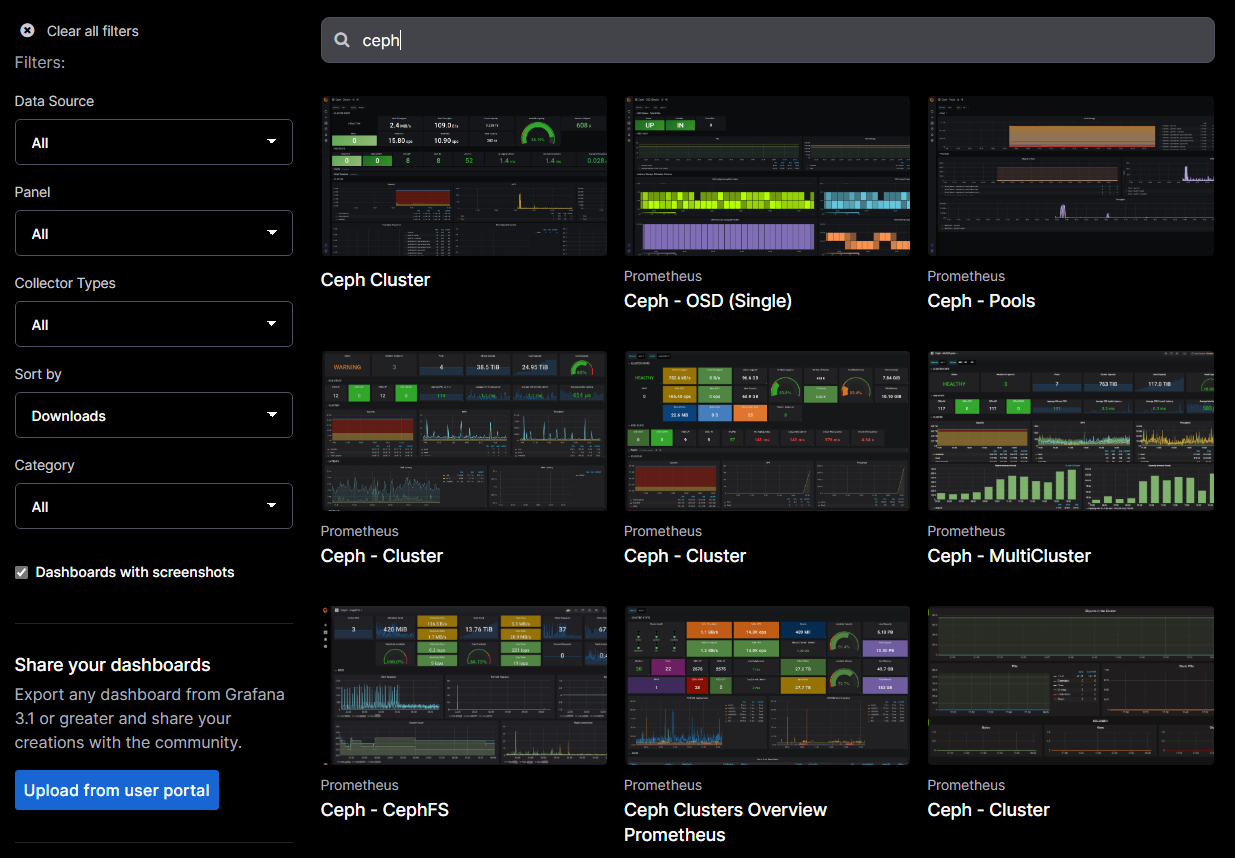
Below is one of the ones that I settled on:
Wrapping up
Creating a Ceph dashboard is a great way to visualize and keep a check on your Ceph data to make sure things are healthy and performance is what you would expect. The steps are very straightforward and don’t take much to set up at all. Using the quick command line command to turn on Prometheus monitoring, you can easily enable the ability to monitor your Ceph cluster. Let me know what you are using if you are monitoring Ceph. I would be curious to know what solutions you are using.
Google is updating how articles are shown. Don’t miss our leading home lab and tech content, written by humans, by setting Virtualization Howto as a preferred source.
About The Author