IPMI Monitoring Supermicro VMware Servers with PRTG
If you are like me, you may be a bit of a monitoring geek when it comes to your home lab and production environments. Proper monitoring can help to quickly identify issues in the environment that might not be noticed until much later. It can also help to create and track trends to see what might be going on over time. I run an all Supermicro home lab environment. One of the great features of Supermicro servers is the built-in IPMI interface that you get, even with the small form factor servers that are well-suited for home lab use. You may not know, but the IPMI interface is a great way to monitor the hardware stats of your Supermicro server as these are exposed via SNMP. Let’s look at IPMI monitoring Supermicro VMware servers with PRTG to see how you can easily create a great hardware monitoring platform for your servers with alerting, etc.
What is an IPMI interface?
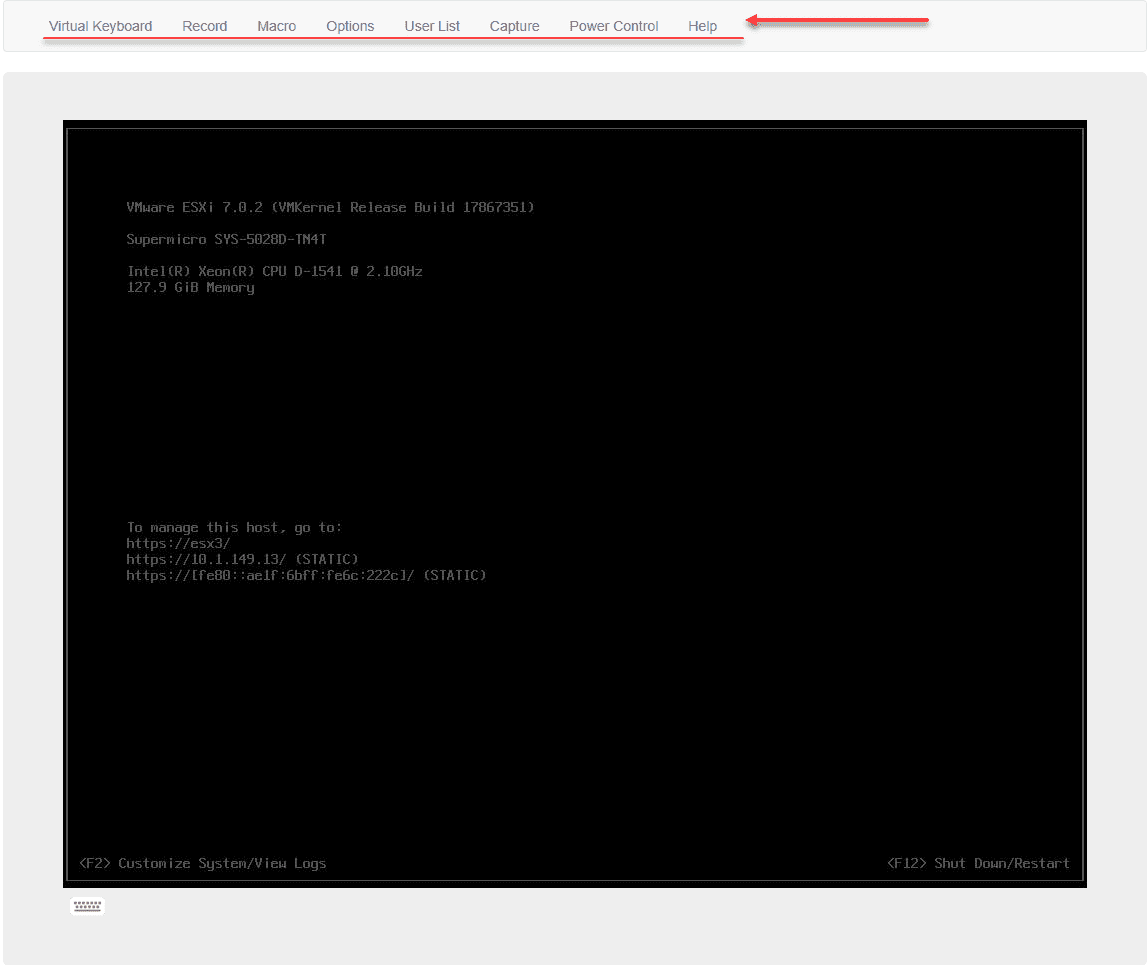
IPMI is short for Intelligent Platform Management Interface. Basically in layman’s terms it is a hardware module that allows you to access, monitor, manage power cycle operations, access remote KVM, and other features. I have to say that with the Supermicro servers, the built-in IPMI module is a great way to manage the server, similar to the Dell iDRAC interface in purpose, etc. What can you do with it? I have written a few articles that I think most of you will find interesting. Things I have done in the past using IPMI:
- VMware ESXi Remote Install using SuperMicro IPMI
- Supermicro VMware Home Lab Automatic Power On and Power Off
- Mount Virtual Media SuperMicro IPMI
- Update Supermicro BIOS using IPMI SUM
These are just a few of the interesting use cases that I have been able to find with the built-in IPMI modules in my home lab servers.
What is PRTG?
Paessler’s PRTG Monitoring platform is a great tool to monitor in your home lab and production environments. It does a great job. Please note, this is not a sponsored PRTG post. It is simply my thoughts and observations using the tool in the home lab with various monitoring use cases. See my various writeups on PRTG to form your own opinions:
- Monitor AWS with PRTG CloudWatch Sensors
- PRTG VMware Host Hardware Status Monitor with SNMP
- PRTG Desktop Released Best Network Monitoring Tools for Windows
- Monitoring VMware vSphere Infrastructure with Paessler PRTG
- Use PRTG Monitor Internet Connection
As a note, you can monitor your lab for free with the PRTG free version that includes 100 sensors, which is enough for most home lab environments to monitor a few hosts.
IPMI Monitoring Supermicro Servers with PRTG
I have written in the past about setting up SNMP monitoring on your Supermicro hosts. Take a look for reference at my post on that topic here:
However, in the above post, it involves quite a bit more complexity for monitoring your Supermicro servers via SNMP. This includes, downloading MIBs, and creating customized SNMP sensors with the appropriate OIDs for each sensor monitor you want to target to pull.
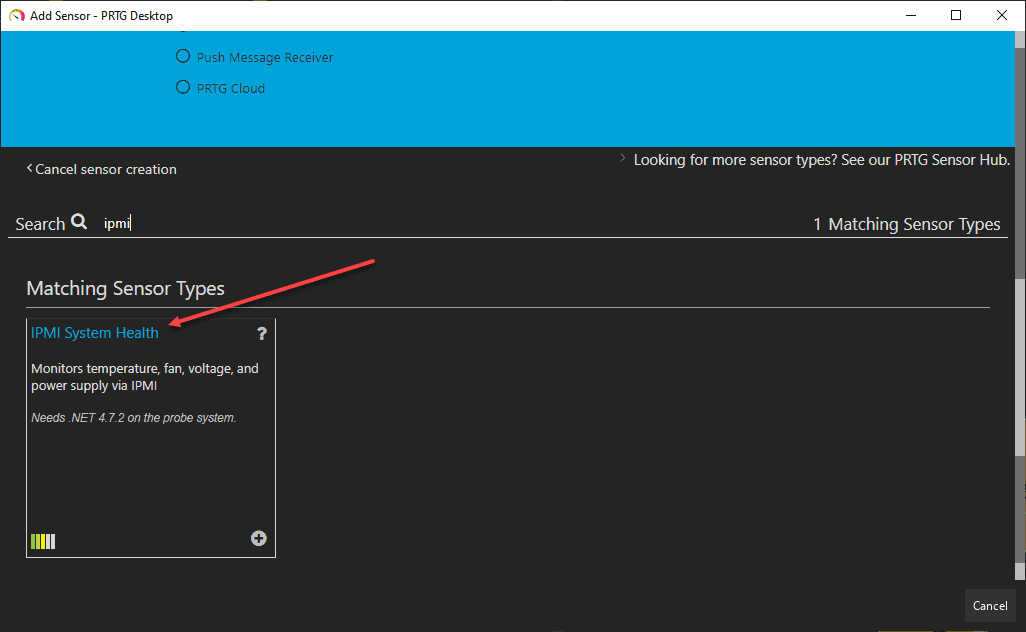
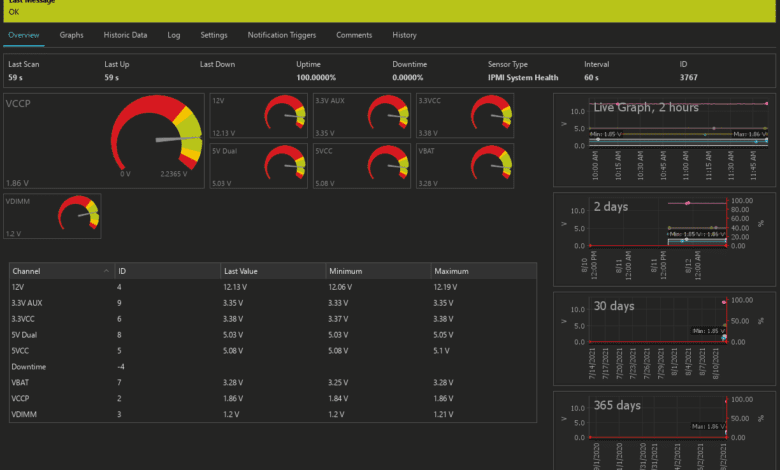
As it turns out, there is a much easier way to pull sensor statistics into PRTG from the Supermicro IPMI interface using a sensor type called the IPMI System Health sensor. As seen in the description, it monitors temperature, fan, voltage, and power supply via IPMI.
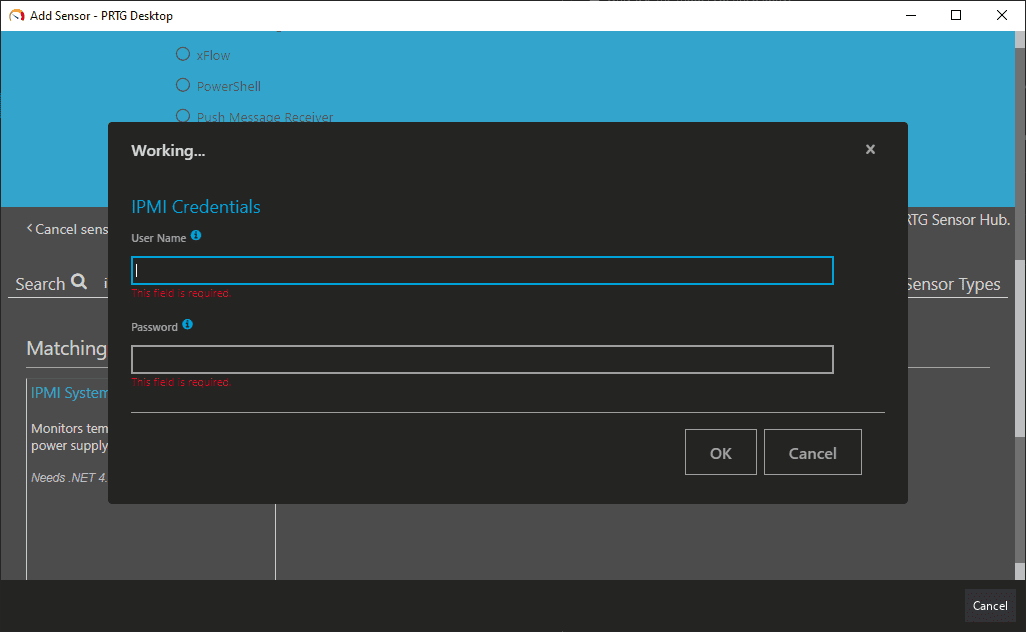
After you click to add the sensor, you will be prompted to log in to the IPMI interface, just as you would have to do when accessing the IPMI interface for other management tasks.
One thing to note, your IPMI address is not the address of your VMware ESXi management IP. The IPMI IP is the connection to the out-of-band management IP that is either configured using DHCP or statically assigned for the IPMI interface IP. You will need to keep this in mind when you configure the device which is the IP of your IPMI interface. I then set the “friendly name” to something like the ESXi management IP + SNMP to know which host I am monitoring.
Comparing the IPMI System Health sensor with Custom SNMP
Below, for comparison, I have two hosts shown. One (10.1.149.15) is monitored using the custom SNMP sensor. The other (10.1.149.16) is monitored with the IPMI System Health sensor. You see the differences in how the information is presented. It might appear the IPMI sensor is less detailed. However, that is not the case.
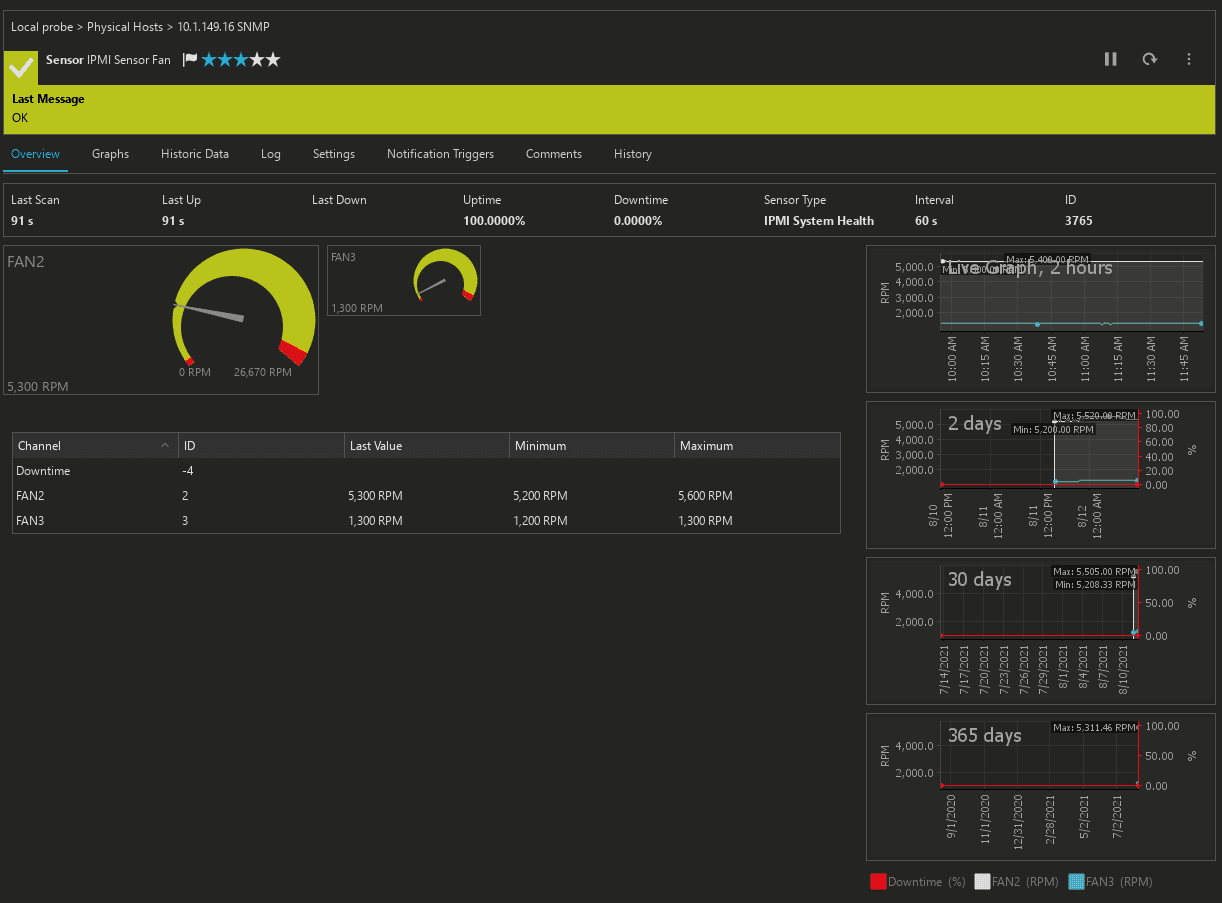
Since the IPMI System Health sensor automatically creates the underlying sensors to monitor fans, IPMI sensor temperature, and IPMI sensor voltage, you see the sub-information for subcomponents by clicking on these parent sensors listed. Below is a look at the IPMI Sensor Fan sensor created using the IPMI System Health parent sensor.
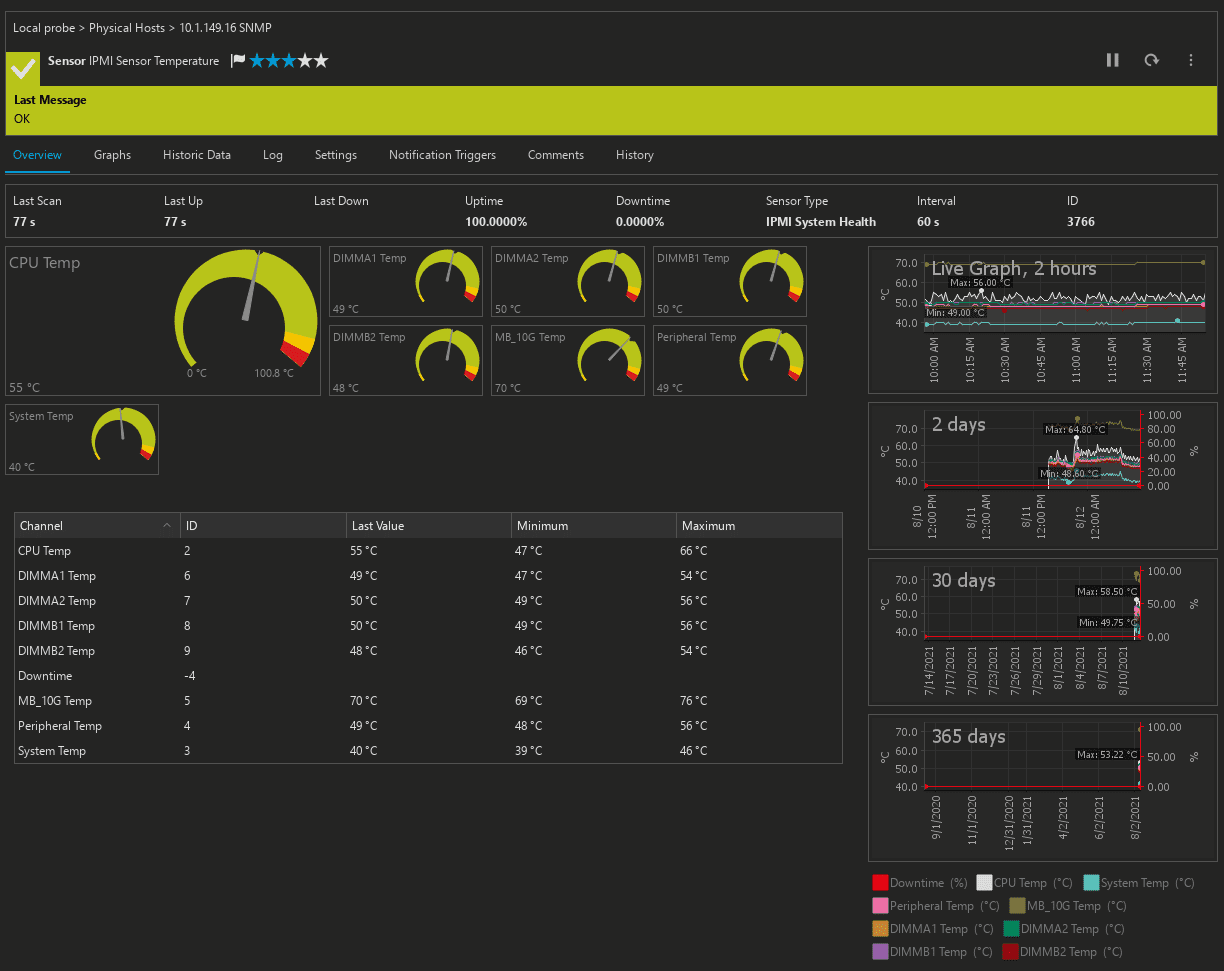
Next is a view of the IPMI Sensor Temperature sensors that are created using the IPMI System Health parent sensor.
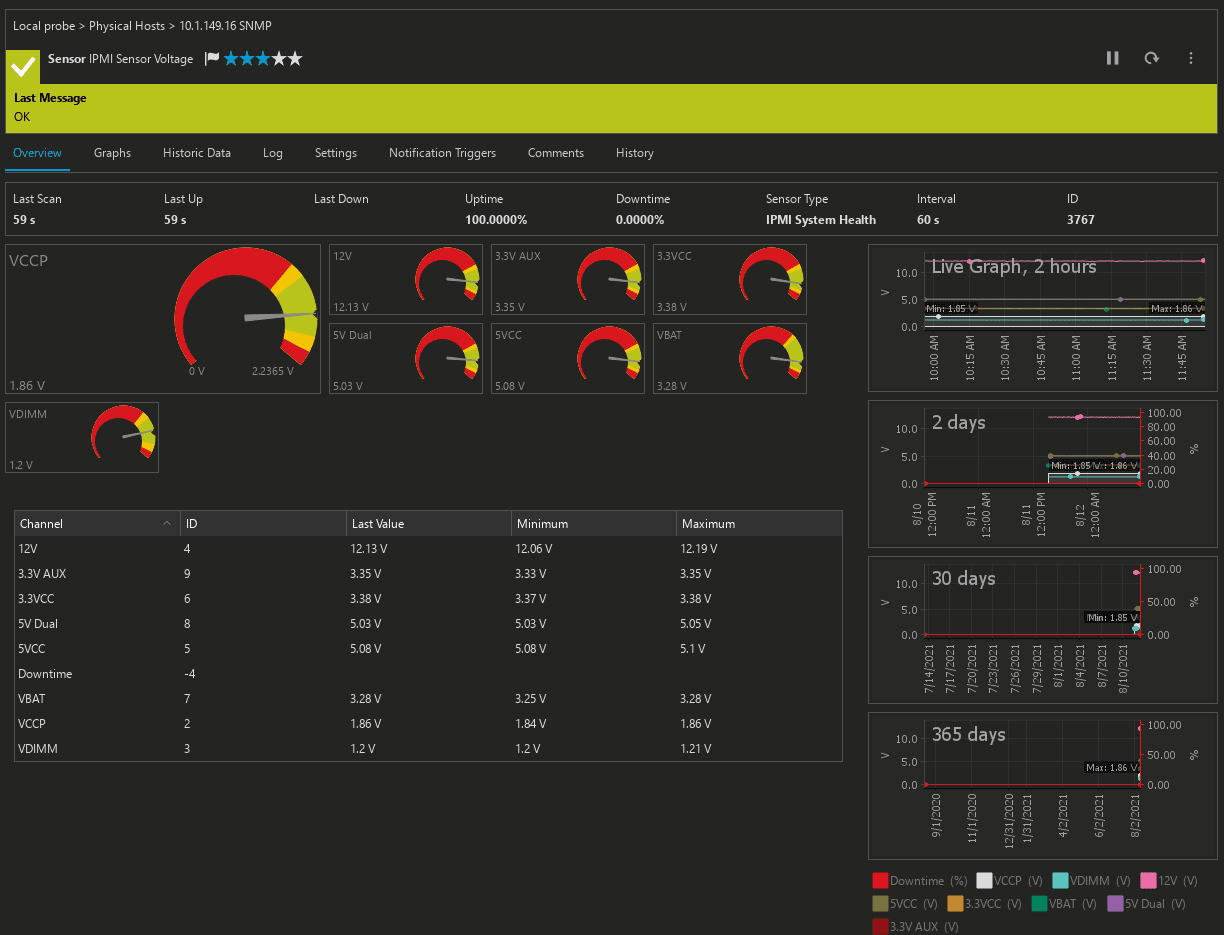
Finally, the IPMI System Health parent sensor shows the status of IPMI Sensor Voltage.
Long story short, the IPMI System Health sensor is a much easier way to manage your Supermicro hosts and it takes all the heavy lifting out of discovering the sensors available. You don’t have to worry about downloading MIBs or setting the specific OIDs for each sensor which can get tedious and time consuming, even with the device templates you can create using PRTG.
Notification settings
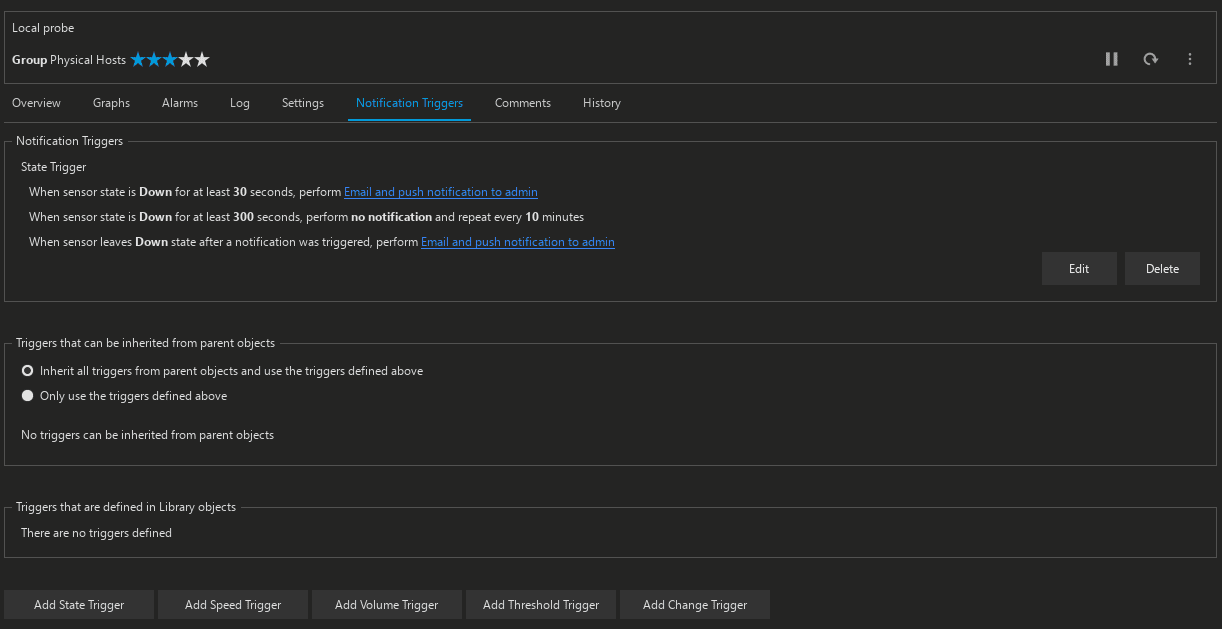
As you can see from the screen captures above, PRTG already has “out of range” thresholds built into the sensors themselves. This helps to take the heavy lifting out of having to define thresholds for each. PRTG will automatically set a sensor as down if it falls out of this range. This means, that you can simply set your notification triggers up to notify if sensor is down. I also like to change the setting in PRTG sensors for things that are critical to automatically set the sensor as down. The default is to set it to a warning first and then if it is “down” again, then set it to down.
PRTG has highly customizable notification triggers that you can set to do whatever you need from emailing to escalating to a page out. You can also choose to get an “all clear” message notification if the down state resolves.
Calling it a wrap
IPMI Monitoring Supermicro VMware Servers with PRTG is easy with the IPMI System Health sensor. It allows quickly adding the hardware monitoring sensors to keep a check on the vitals of your Supermicro servers. Note, this is not a Supermicro-specific sensor. You can use this with any other IPMI spec’ed module. As mentioned, when compared to the custom SNMP sensor that requires tediously defining OIDs and working with MIBs, the IPMI System Health sensor is highly preferred.


