New vsantop vSAN Command-Line Troubleshooting Tool
Well, everyone is certainly pumped up after this year’s VMworld event with many great new announcements and features that are coming to VMware vSphere very soon. Just before VMworld however, VMware released vSphere 6.7 Update 3, including vSAN 6.7 Update 3 with many great enhancements. Check out the post here on vSAN 6.7 Update 3 new features to get a good overview of what’s new with vSAN 6.7 Update 3. One of the new features that certainly caught my attention was the introduction the new vsantop vSAN command-line troubleshooting tool. This looks to be a great addition to the list of troubleshooting tools at the disposal of VMware vSAN administrators. Let’s get a better overview of the new vsantop utility and some of the basic syntax.
vsantop Menus and Information
My first impression of the vsantop utility is that it provides an enormous amount of information to have at your fingertips related to vSAN. As we have all grown to love and use the esxtop utility, the vsantop utility is its counterpart in the realm of vSAN providing very valuable metrics that can certainly help with troubleshooting vSAN and seeing at a very low level what is going on in the vSAN environment.
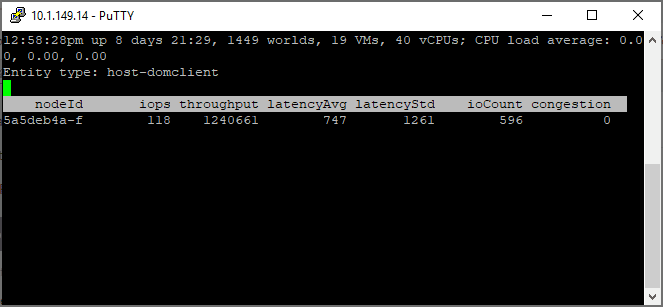
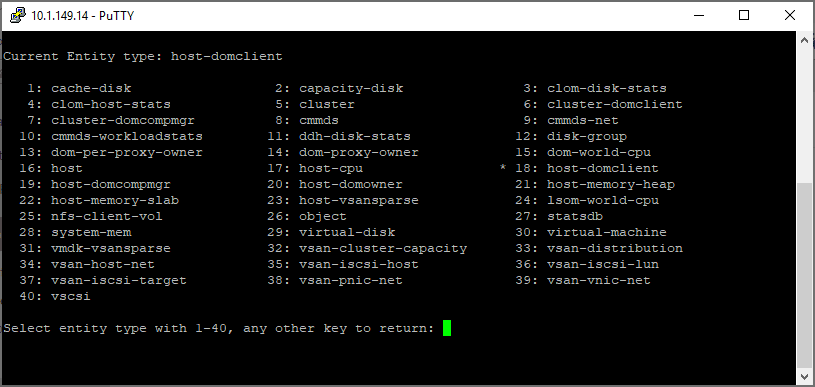
Getting to the vsantop utility is as easy as typing vsantop at an SSH shell prompt connected to an ESXi server. The default entity type selected by default is the host-domclient.
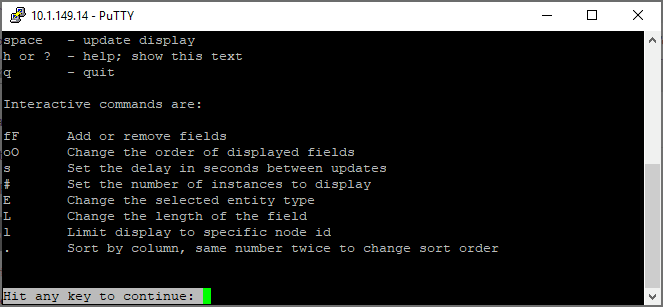
To get to the help menu, just hit the “h” key. When you view the help screen, you will see the help with the interactive commands available much like you get with esxtop. You can:
- Add or remove fields
- Change the order of displayed fields
- Set the delay in seconds between updates
- Set the number of instances to display
- Change the selected entity type
- Change the length of the field
- Limit display to specific node id
- Sort by column, same number twice to change sort order
As documented by VMware on using vsantop command-line tool:
| Command | Description |
|---|---|
| ^L | Redraw screen |
| Space | Update display |
| h or ? | Help; show this text |
| q | Quit |
| f/F | Add or remove fields |
| o/O | Change the order of displayed fields |
| s | Set the delay in seconds between updates |
| # | Set the number of instances to display |
| E | Change the selected entity type |
| L | Change the length of the field |
| l | Limit display to specific node id |
| . | Sort by column, same number twice to change sort order |
The new vsantop utility contains information for 40 different entities that can be viewed within vSAN. Each entity allows you to change the perspective of the information displayed from the context of the host, cluster, CPU, memory, disk, virtual machines, network, etc. There is an incredible amount of information that can be displayed here. Entities include:
- cache-disk
- capacity-disk
- clom disk stats
- clom-host-stats
- cluster
- cluster-domclient
- cluster-domcompmgr
- cmmds
- cmmds-net
- cmmds-workloadstats
- ddh-disk-stats
- disk-group
- dom-per-proxy-owner
- dom-proxy-owner
- dom-world-cpu
- host
- host-cpu
- host-domclient
- host-domcompmgr
- host-domownder
- host-memory-heap
- host-memory-slab
- host-vsansparse
- lsom-world-cpu
- nfs-client-vol
- object
- statsdb
- system-mem
- virtual-disk
- virtual-machine
- vmdk-vsansparse
- vsan-cluster-capacity
- vsan-distribution
- vsan-host-net
- vsan-iscsi-ost
- vsan-iscsi-lun
- vsan-iscsi-target
- vsan-pnic-net
- vsan-vmnic-net
- vscsi
After pressing “E“, then simply type in the number of the entity you want to view.
Troubleshooting with vsantop Command-Line Tool
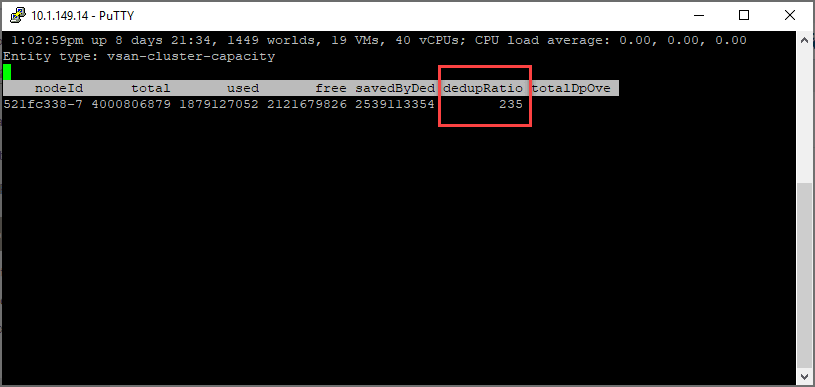
It doesn’t appear like VMware has a lot of official documentation out as of yet covering the vsantop utility. However, just poking around, I found several useful pieces of information with the various entities. Looking at the vsan-cluster-capacity screen, you see the dedupRatio column. This is especially when you have deduplication and compression enabled.
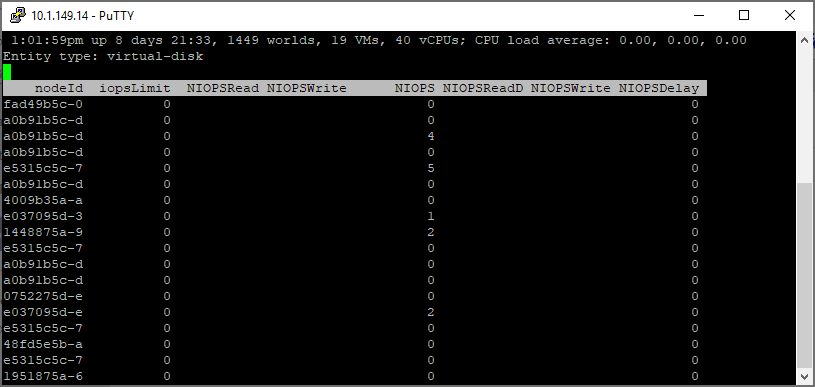
Looking at the virtual-disk screen yields some really good information as well.
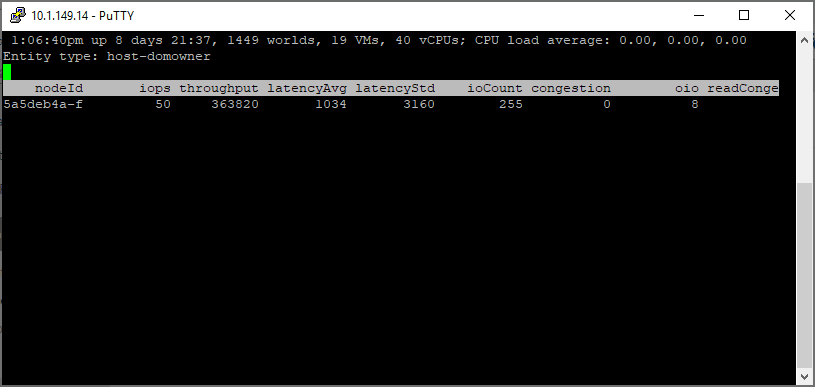
In the host-domowner screen, you readily see the throughput, latencyAvg, latencyStd, ioCount, congestion and other metrics. The congestion metric would certainly be a good metric to take a look at among others when performance or other issues are being encountered in the vSAN environment.
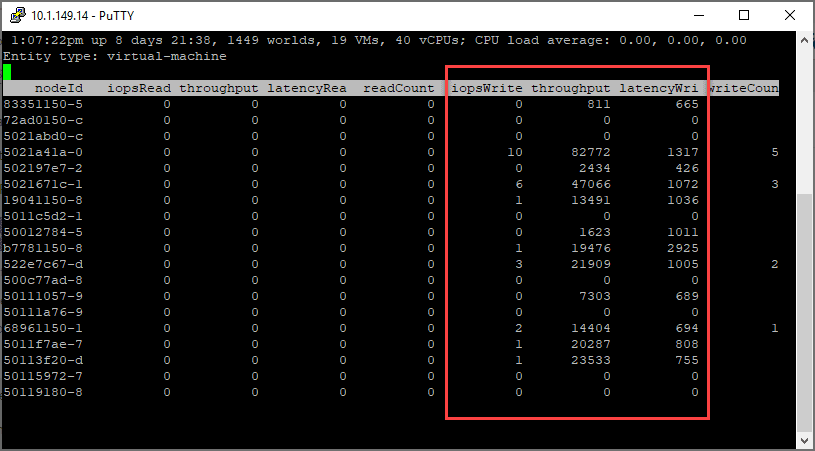
The virtual-machine entity screen is another really useful screen that shows very relevant information when troubleshooting VM performance on vSAN, including iopsWrite, throughput, and latencyWrite.
The metrics are not all disk related. One of the extremely important components of vSAN is the network. The vsan-pnic-net entity screen shows very valuable information related to the underlying network feeding vSAN. Here you see rxThroughput, rxPackets, txThroughput, etc.

Wrapping Up
VMware is continuing to make VMware vSAN better and more powerful with each release. This not only includes features within the solution, but also the troubleshooting tools that are provided to interact with vSAN to allow vSphere administrators to troubleshoot the solution effectively when and if problems arise. The New vsantop vSAN Command-Line Troubleshooting Tool is shaping up to be an extremely nice addition to the bag of troubleshooting tools available to vSphere administrators. Once you update to vSphere 6.7 Update 3, you will have full access to the new tool. Yet, another reason to get the update applied as soon as possible!

