PRTG Desktop Released Best Network Monitoring Tools for Windows
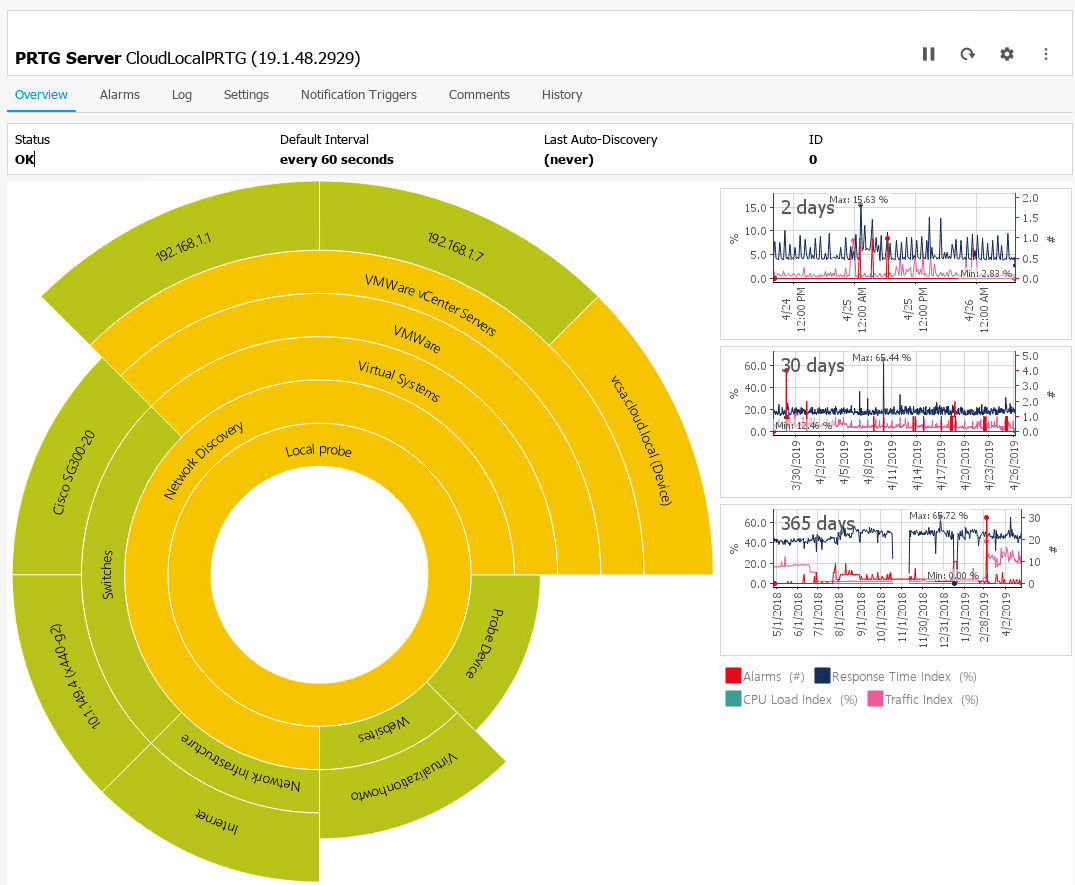
Monitoring is one of those things that no one enjoys doing and usually it gets neglected. However, this is general because the right tools are not used. When something is difficult and unfruitful, we tend to shy away from doing them. I really believe this is the case with monitoring. Without the right tools and having to hunt and search for problems, being reactive instead of proactive, this kills the motivation for effective monitoring. When it comes to monitoring network and infrastructure environments, PRTG is one of the best. Typically, when working with environments, if no monitoring solution exists, I highly recommend PRTG. Recently, PRTG has released a much improved desktop client called PRTG Desktop. In this post, we will take a look at PRTG Desktop released best network monitoring tools for Windows.
PRTG Desktop Released Best Network Monitoring Tools for Windows
What is PRTG Desktop? It is a native application that allows managing multiple PRTG instances. PRTG Desktop interacts with PRTG Network Monitor, a server installation of the PRTG monitoring solution. You can download it for free here. PRTG offers a great solution for trialing their software. You have unlimted access for 30 days and after 30 days, PRTG reverts to a free version that includes 100 sensors for free. This is a really generous amount of free sensors and would fit most home labs or even small production environments.
As mentioned, PRTG works off the idea of a “sensor”. Sensors can be compromised of any number of things. It can be a monitor setup for any of the following (and much more):
- Traffic
- Packets
- Applications
- Bandwidth
- Cloud services
- Databases
- Virtual Environments
- Ports
- IPs
- Hardware
- Web services
PRTG supports most technologies found in environments today including:
SNMP (all versions), Flow technologies (i.e. NetFlow, jFlow, sFlow), SSH, WMI, Ping, and SQL. Powerful API (Python, EXE, DLL, PowerShell, VB, Batch Scripting, REST) to integrate everything else.
Installing PRTG Desktop
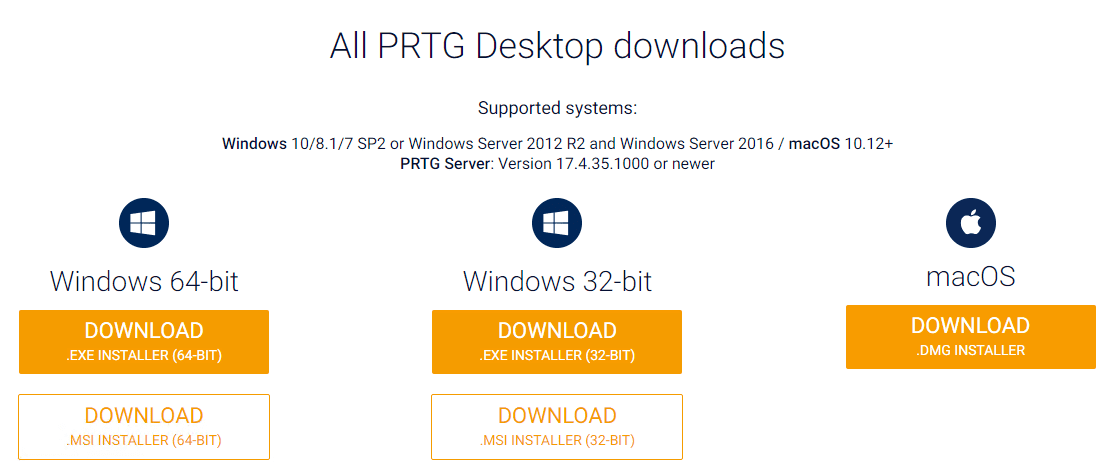
First things first, after standing up the PRTG Network Monitor server in your environment, you will need to download the version of PRTG Desktop for your platform. You can download it here:
https://www.paessler.com/prtg-desktop-app
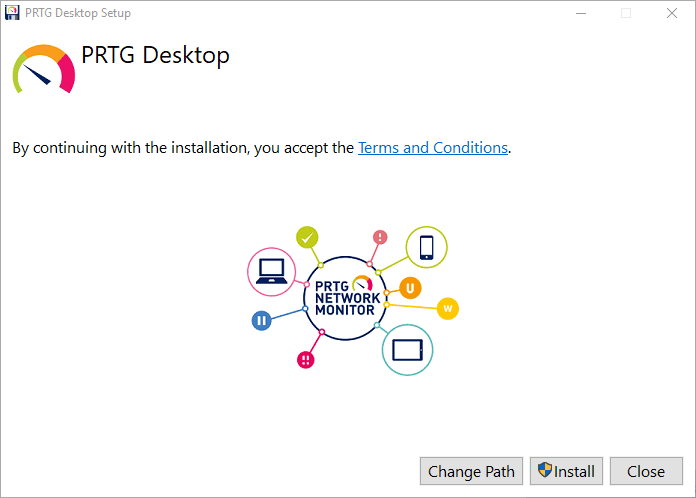
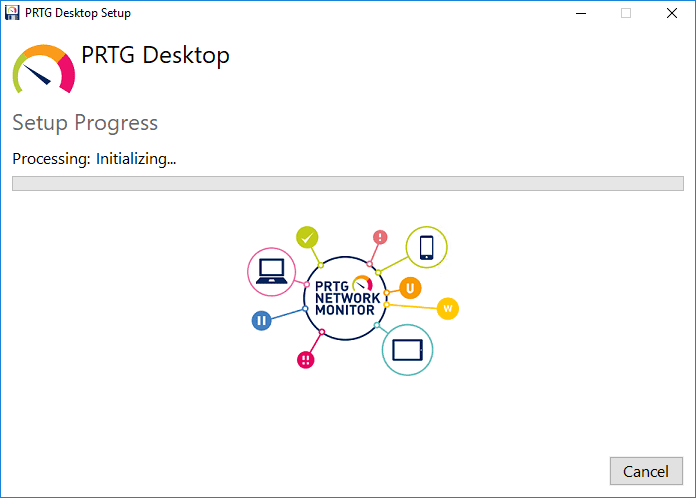
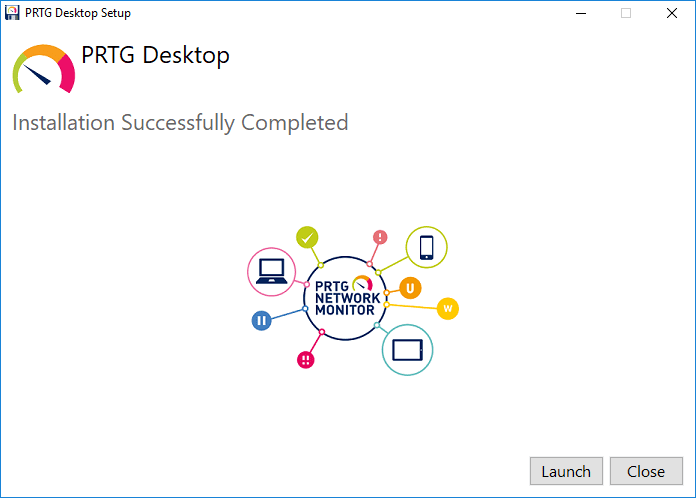
The PRTG Desktop installation couldn’t be easier. Simply running the installer and clicking Install is the extent of what you have to do. The new app will install in under 10 seconds on most systems.
Installation completes successfully.
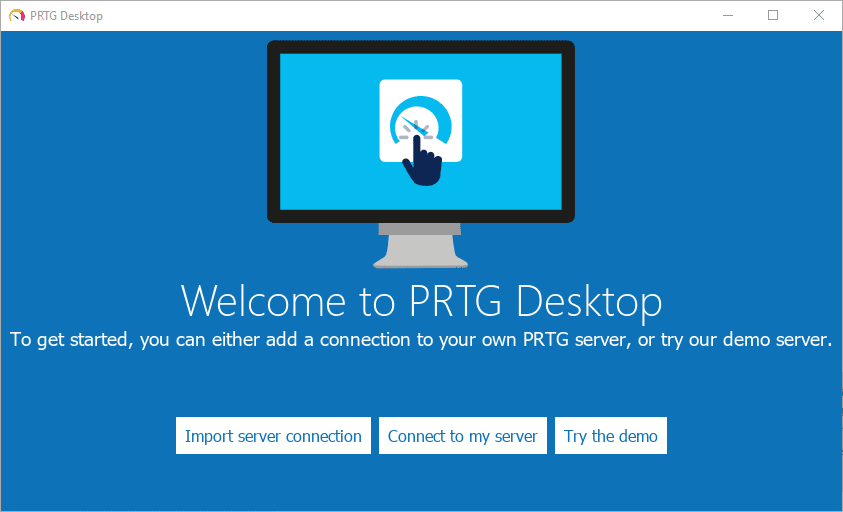
PRTG Desktop recognizes if a connection to a PRTG server exists in the form of the Enterprise Console which previously was the native “fat” client installation of PRTG. If you have that installed, you will see the Import server connection which will bring your connection details over from Enterprise Console to the new PRTG Desktop app. If you simply want to configure a connection manually, click the Connect to my server button.
Below, I am setting up a new connection. All of the normal requirements for connection information are expected.
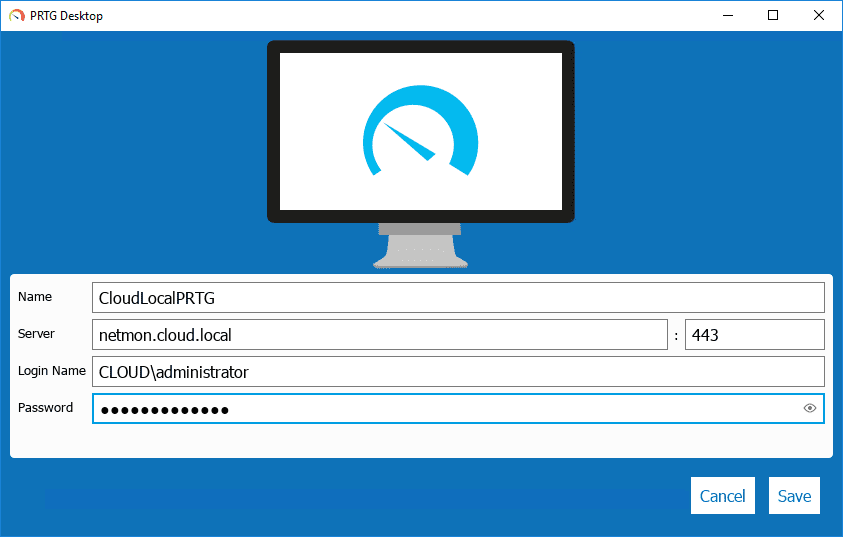
You may see a certificate warning if you are like me and running a self-signed cert in the lab.

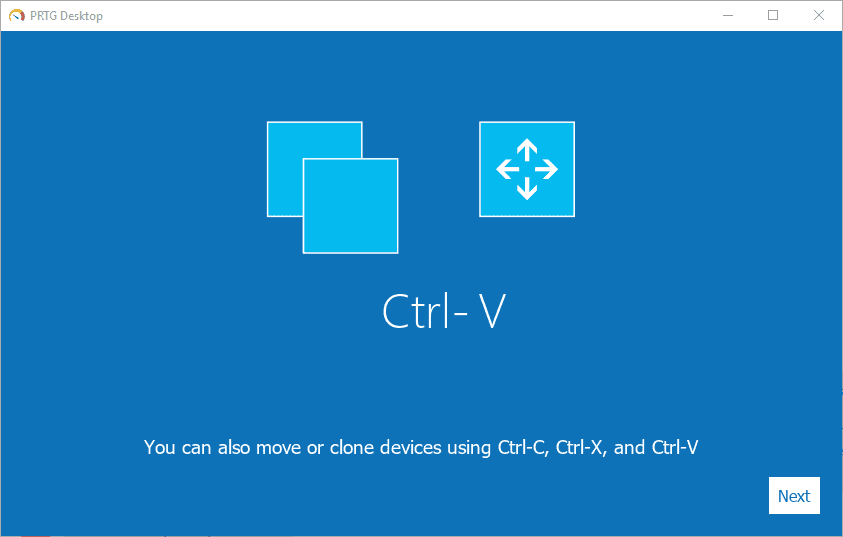
After configuring your connection, you will see a few screens of tips and functionality in PRTG Desktop. The first is a note about being able to drag and drop objects in the interface.
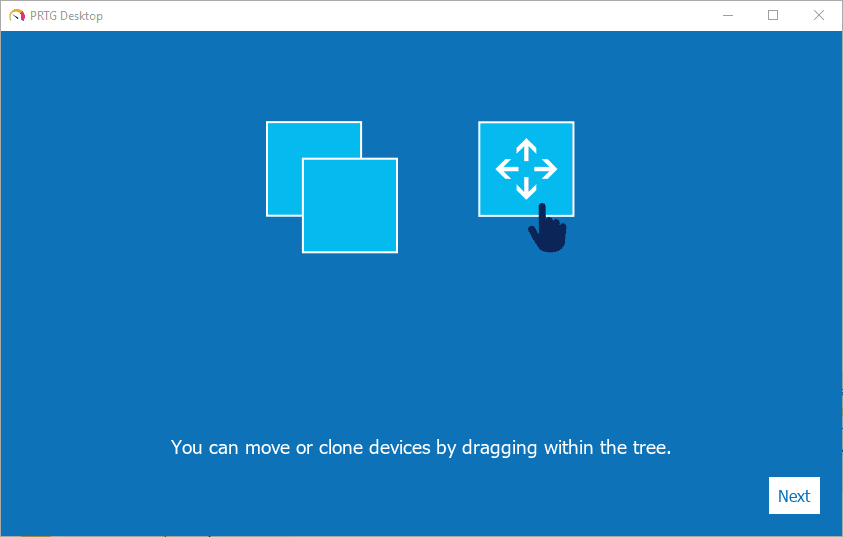
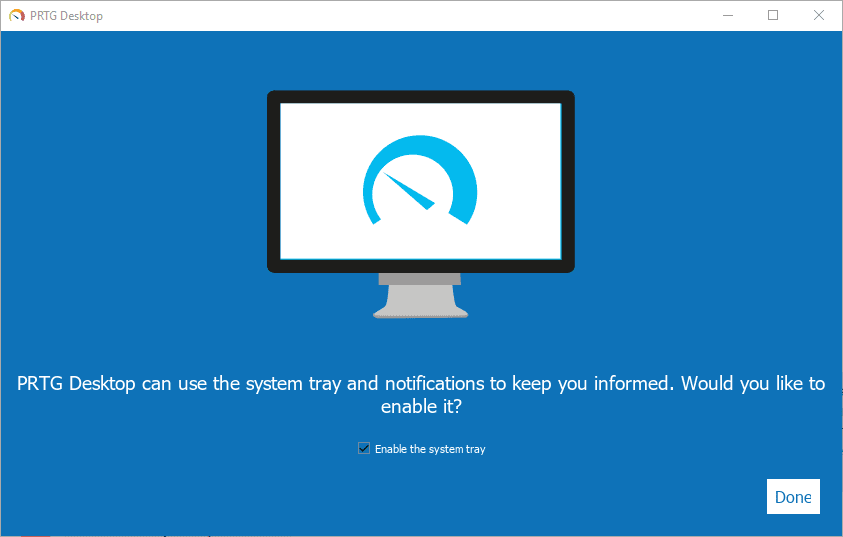
The PRTG Desktop app can notify you with desktop alert notifications of errors in the environment as these happen so you can stay up to date with events as they happen.
New PRTG Desktop Interface
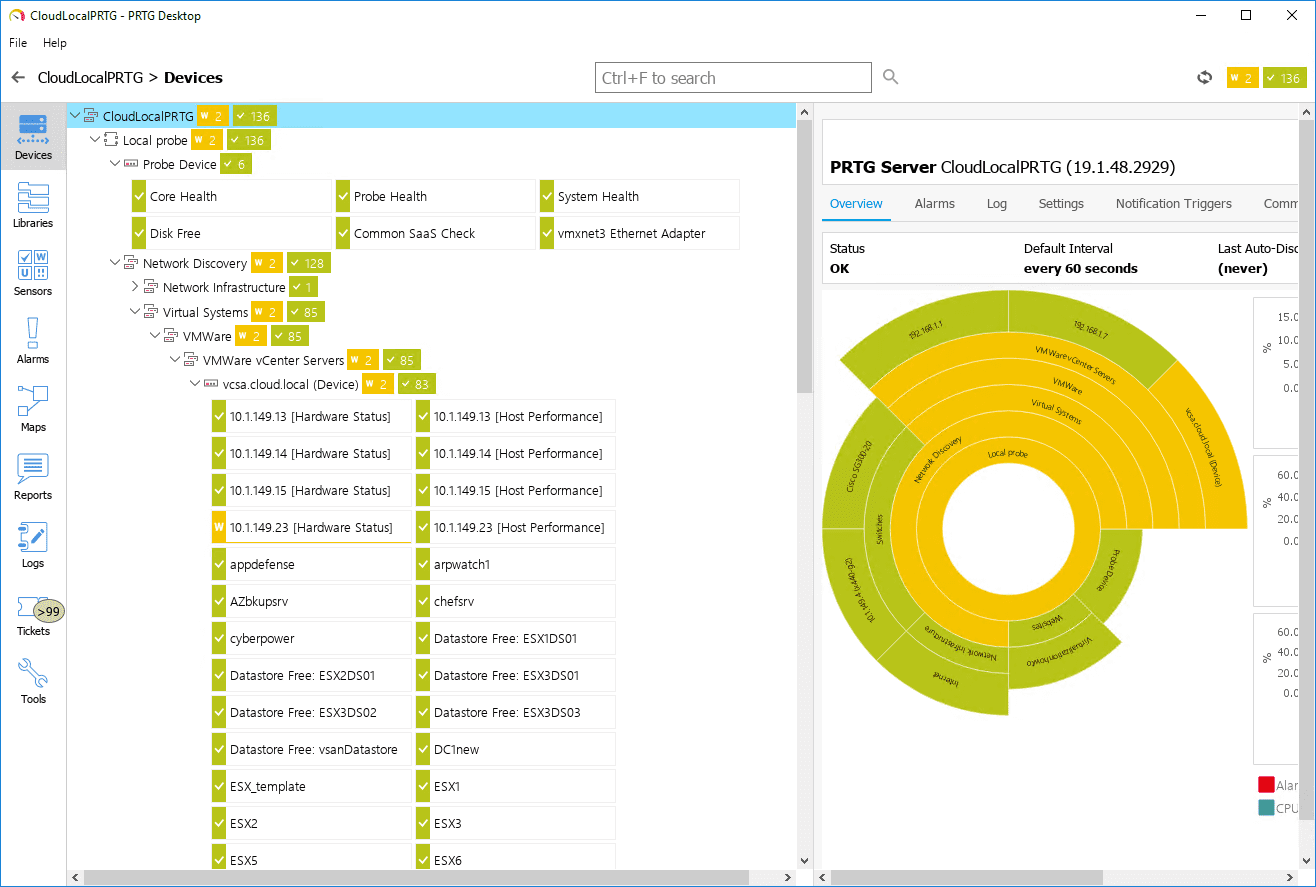
I am really impressed with the new PRTG Desktop interface. It is a huge improvement over the legacy Enterprise Console native application. The PRTG Desktop app “feels” lightweight, quick, and extremely fast. The layout is extremely intuitive and you have all of the pertinent information right at your fingertips.
The design of the PRTG Desktop app is very modern with the various components of the app accessible from a left-hand sidebar menu. You have access to devices, libraries, sensors, alarms, maps, reports, logs, tickets, and tools and easy navigation between them all.
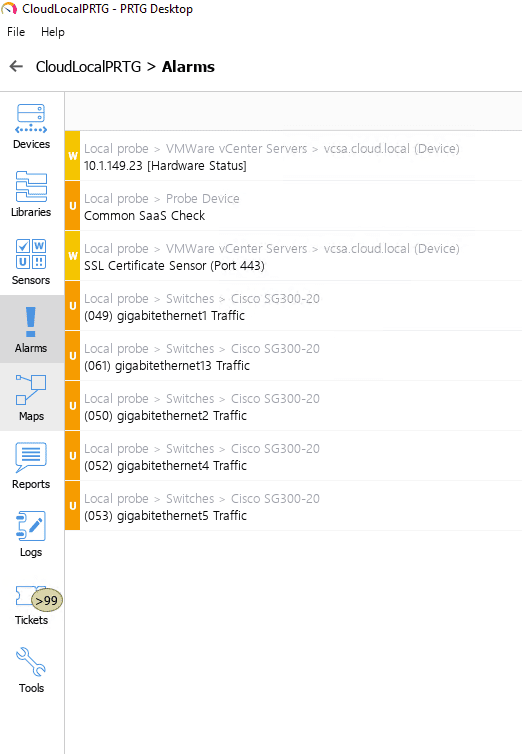
Just a few views below. The Alarms menu showing the current active alarms in my lab environment.
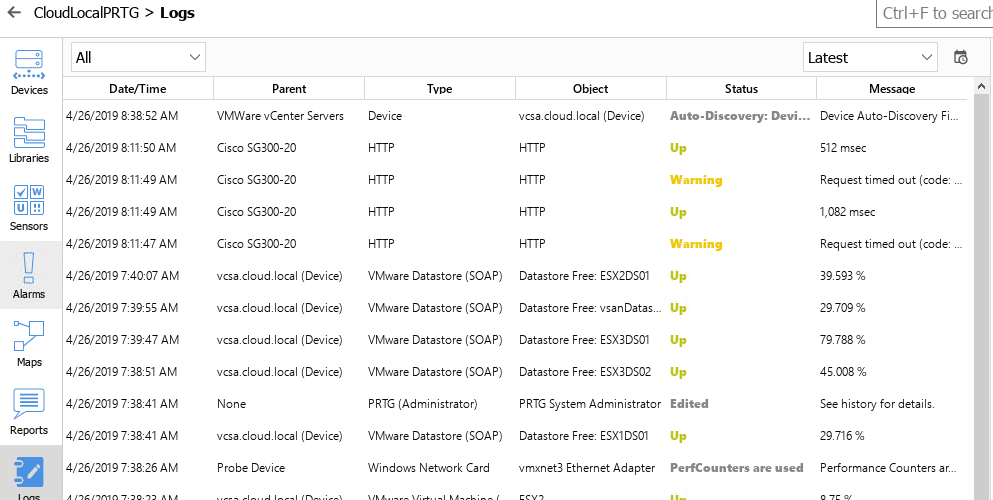
The Log view is a more verbose view of the environment showing active logs including statuses, errors, devices, etc.
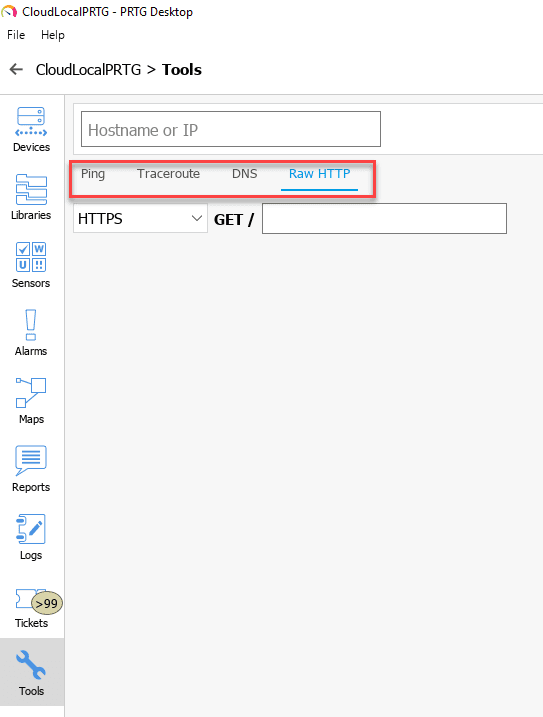
While not a wealth of tools, the (4) tools built into the interface are extremely helpful in setting up sensors. The Raw HTTP tool is helpful in content checks that you want to throw a sensor on. Of course the general ping, traceroute, and dns tools are helpful as well.
Again, between the various modules of PRTG Desktop, you have a wealth of information at your fingertips, all in the new PRTG Desktop app.
Wrapping Up
PRTG Desktop is a really great new tool that presents the PRTG monitoring information in a very fast, consumable, and intuitive interface. This helps to take PRTG to the next level of usability and functionality. The functionality and features that PRTG offers are tremendous and powerful when looking to monitor health and performance of very complex infrastructures. PRTG has the capabilities to just about do it all. If you have a need to monitor a system, most likely PRTG has a sensor that will cover it. Be sure to download the free trial copy of both PRTG Network Monitor (server) and PRTG Desktop client to try out this really superb monitoring solution.

