In looking at firewall upgrades for home lab and network, I have been taking a look at a variety of firewalls. Recently, I was able to get my hands on a Meraki MX64 to try out. Just a note here, I am going to prepare another post on my thoughts of the Meraki security appliance – likes and dislikes. One thing became especially clear to me that a con I will mention here is the lack of built in logging visibility from the Meraki cloud interface. Many suggested that syslog was the only answer here. I of course looked to Splunk as a known that I had used in the past. Let’s take a look at how to configure Splunk for Meraki MX firewall logging.
Configure Splunk for Meraki MX
First things first, the install of Splunk is very easy to get up and running on a Linux box and literally takes minutes from install to logging into the Splunk web interface.
Pull down the latest version of Splunk from the website. You can pull down the Enterprise version which will operate for 30 days and then transition over to the free version which has limits on amount of data and indexing that can be done. For home use, you most likely won’t hit those limits.
After installing the flavor of Linux you want to use – in this case using Ubuntu 16.04, copy over the installation file (.deb) for Ubuntu to the Linux box/VM. I simply copied over to the /tmp folder.
Run the command below to install replacing the exact filename. Here I am installing version 6.5.1
sudo dpkg -i tmp/splunk-6.5.1-xxxxxx-linux-2.6-amd64.deb
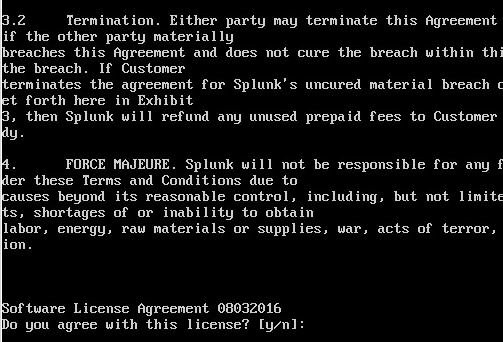
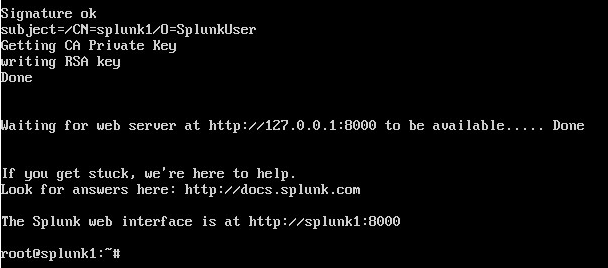
Below are a few of the screenshots during the installation process.
Very quickly you get to the message that the web interface is already available.
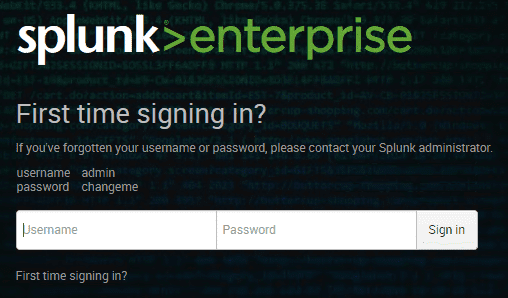
You will be prompted to change the default password which out of the box is admin changeme.
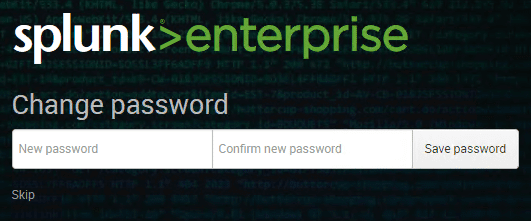
Changing the password.
Setting up Splunk
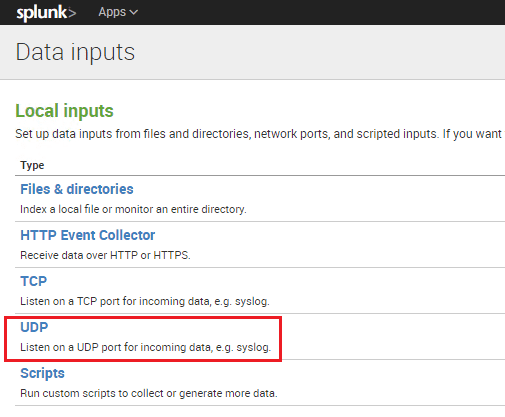
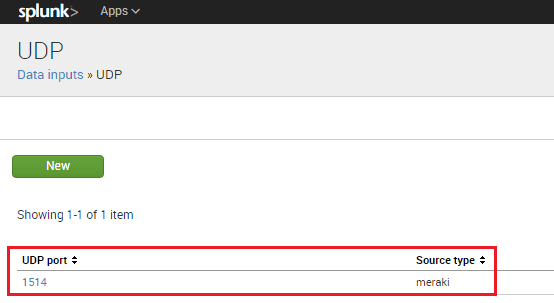
We need to add a data input listener for Splunk on the port we want to use to send across from our Meraki environment.
Here I used port 1514 but this can be any port you choose that is available.
To send log data from Meraki to your Splunk server, you enable and add your syslog server in Network-wide >> General >> Reporting >> Syslog servers. You can enable certain roles to send different types of data. Below I have mainly all the roles available for the MX appliance.
After adding the syslog server pointing to my Splunk installation with a sourcetype set to meraki, I started seeing data come in.
Splunk Meraki App
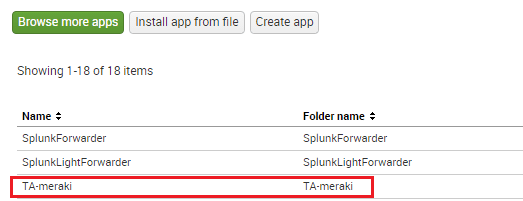
Splunk these days is very modular with the ability to integrate pre developed apps that extend and augment the functionality of Splunk to be better tailored to certain vendors, devices, etc. There is an app available for download in Splunkbase called TA-meraki. This app extends the logging capabilities of Splunk.
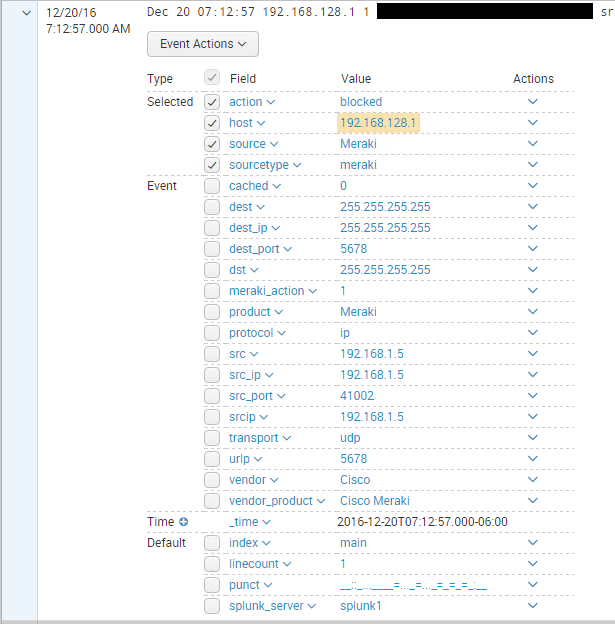
After adding the app, I could see the action type now as well as had tons of other data fields.
The TA-meraki app adds many data fields that can be used to filter and display your data.
A note here also – Inbound firewall logging is enabled by default as you see here.
However, any outbound rules have logging set to disabled by default. These would need to be enabled.
Thoughts
In my opinion setting up syslogging with Meraki is essential if you truly want to consider this platform for a security solution. The process to configure Splunk for Meraki MX is not difficult and with the modular nature of Splunk now with the meraki apps, the data that can be captured and indexed is very robust. Look for an upcoming post on my complete thoughts with the Meraki MX security appliances.
Google is updating how articles are shown. Don’t miss our leading home lab and tech content, written by humans, by setting Virtualization Howto as a preferred source.


