Using IFTOP on Untangle for realtime bandwidth monitoring

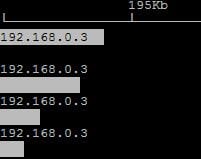
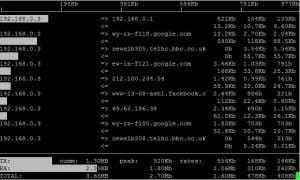
Many Linux users may be familiar with the tool IFTOP listens to network traffic on a chosen interface and then displays this information in a handy bar graphical representation which makes it easy to see offending IP addresses which may be sucking down inappropriate amounts of bandwidth. The paid version of Untangle provides access to the “Bandwidth Control” rack module which has a subset module called “Bandwidth Monitor” which can provide graphical data, however, we have simply found this functionality in the module to be sluggish and not exactly realtime as the module touts. It is definitely a great start, but we hope to see a much better interface for this Untangle module in the future with a truly realtime interface with a much better graphical output. This is where IFTOP steps in.
The great thing also about IFTOP with Untangle is that you DON’T have to have the Bandwidth Module installed to use this and it is honestly better than the bandwidth monitor that is provided in the paid Bandwidth Control module.
To view the bandwidth usage in realtime on your Untangle box, simply SSH into Untangle and launch the IFTOP module. The following syntax will work for most:
iftop -i eth1 -n
Keep in mind on the above interface to replace this with the actual interface you would like to monitor on your box. Pressing the H or ? in the session will open up the help menu which displays the various switches and options that are available.
Final Thoughts
Using IFTOP on your Untangle box is a great way to quickly see where bandwidth is being used on your WAN connection. You don’t have to have the Bandwidth module installed to utilize the realtime monitoring provided by the IFTOP utility so best of all, it is FREE.


